This article is part of Fortune‘s quarterly investment guide for Q1 2020.
We are living in the longest economic expansion in American history. When the last recession hit in December 2007, most of us still had flip phones and hadn’t yet created a social media presence. And many younger workers today have no clue what a downturn looks like. Case in point: Justin Bieber was 15 when the Great Recession ended in the summer of 2009.
But the hard truth is the good times are going to end—the only question is, When?
Some economic signals are already flashing yellow or even red. In August the U.S. yield curve temporarily inverted—long seen as a recession precursor. And in the final months of 2019, the U.S. manufacturing sector started to contract. Then again, the economy is still hitting some high notes, like rising building permits and a strong holiday shopping season.
To get an indication of where the economy is headed in the early months of 2020, Fortune pulled nine top economic indicators. We looked at both leading economic indicators like new building permits and the purchasing manager index, along with core economic stats like GDP and the unemployment rate. Taken together they can give investors a sense of where things are today—and where they might be headed.
The charts are shaded between December 2007 and June 2009, when the U.S. economy was last in recession.
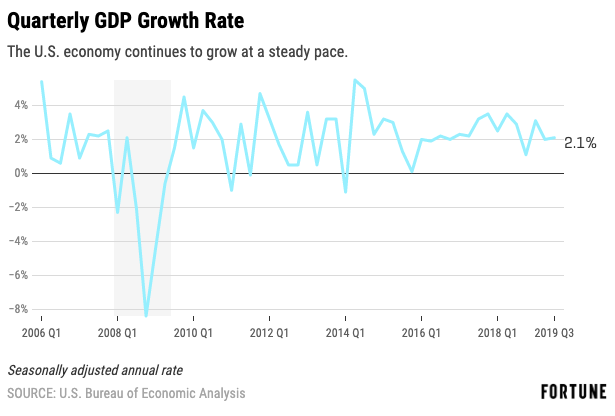
The U.S. economy grew at 2.1% in the third quarter of 2019. That’s neither robust nor weak. It’s a steady uptick that is similar to what we’ve seen in most quarters during this record long expansion.
But the latest GDP numbers also show some weakness, including declines in exports and private investment. But those drops are offset by consumer spending, which continues to push the economy forward.
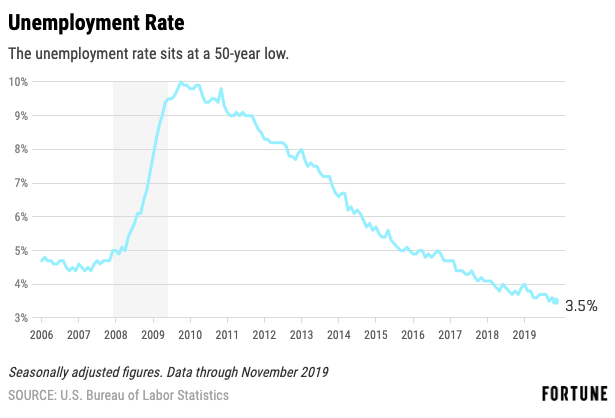
The unemployment rate is well below the 5% rate that many economists recently considered full employment in the U.S. That’s helping Americans secure bigger paychecks.
Economists consider the jobless rate a strong lagging indicator, meaning it’s an excellent snapshot of what is happening now, but it doesn’t really tell us what is coming next.
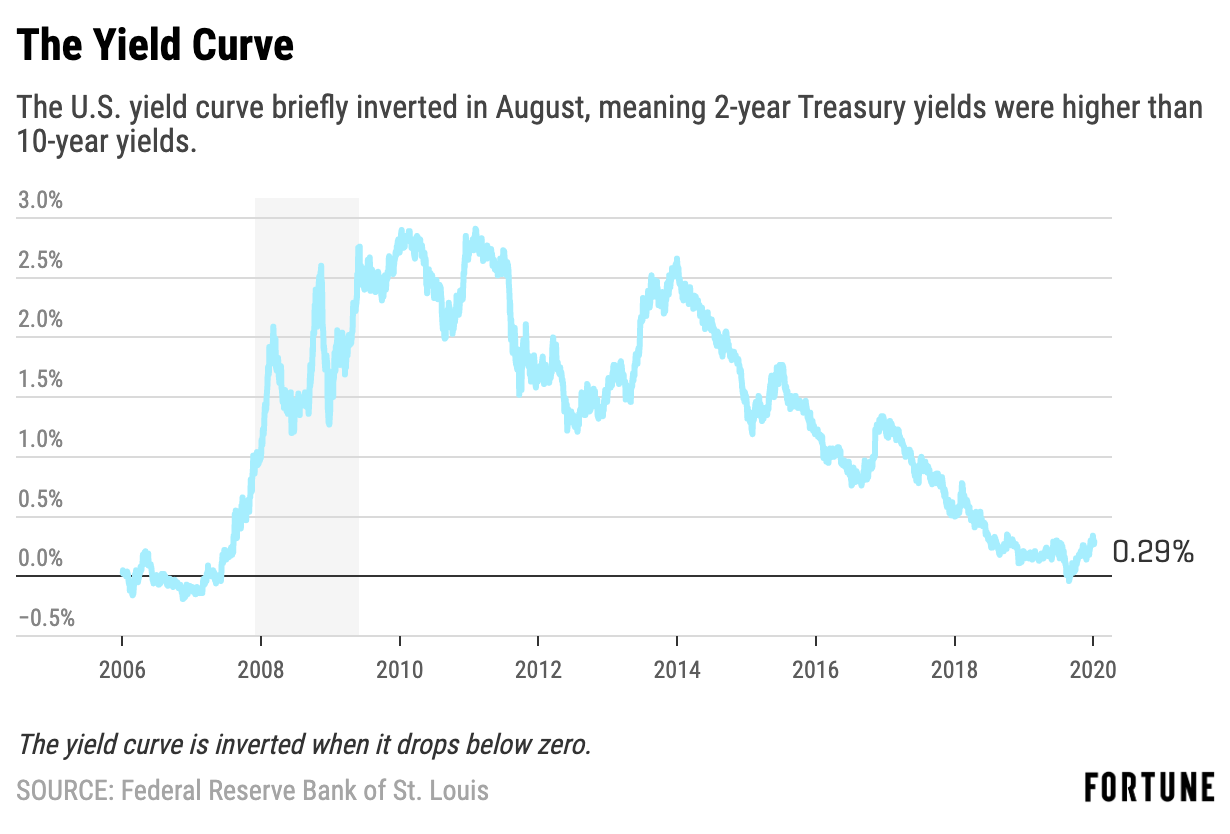
The yield curve inverted in August 2019 when long-term rates were temporarily lower than short-term rates. That’s important because it signifies that long-term outlook is poor, and usually this precedes a recession. The good news is that long-term Treasury rates have since improved relative to short-term rates.
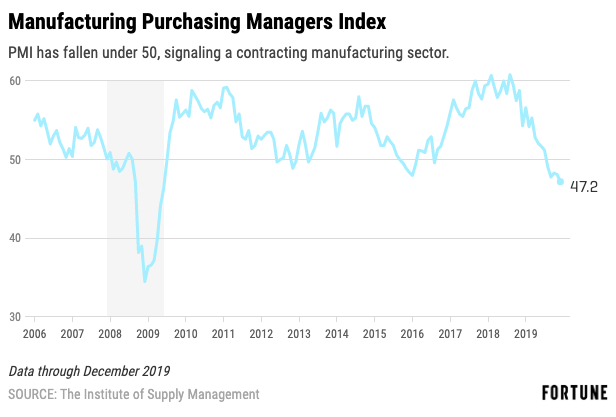
In December, American manufacturing posted its worst month since the Great Recession. Whenever PMI drops under 50, it signifies a contraction in the sector. We’re currently at five straight months with the index under 50.
“The headline numbers are bad. This is the weakest it has been in 10 years,” says Tim Fiore, the chair of Institute of Supply Management’s Manufacturing PMI Business Survey Committee. This is a moderate contraction, he says, and is the result of the U.S.–China trade war.
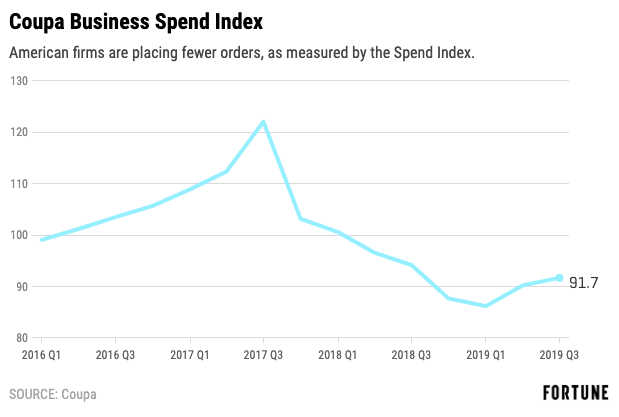
When businesses start pushing back business orders or canceling them, it can forewarn of troubling economic times ahead. In the latter half of last year, firms did just that. However, “the US economy is expected to continue to expand over the next three to six months with growth accelerating modestly, based on insights from the Coupa BSI,” says Jeff Collins, lead economist at Coupa. “Planned business spend appears to be rebounding as trade concerns wane and Fed interest rate cuts propel the longest expansion in U.S. history.”
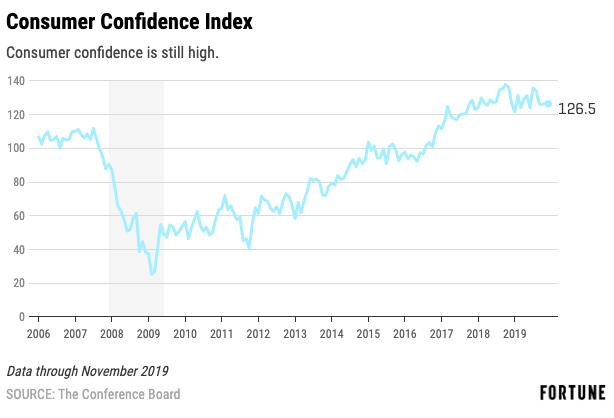
Consumers are the backbone of the economy. As exports and business investment fall, consumer spending is what’s keeping GDP figures moving upward. So it’s good to hear that consumers are still confident.
“Consumers continue to support economic growth, but on the other hand we don’t expect significant growth in consumer spending or the economy as a whole,” says Lynn Franco, senior director of economic indicators and surveys at the Conference Board.
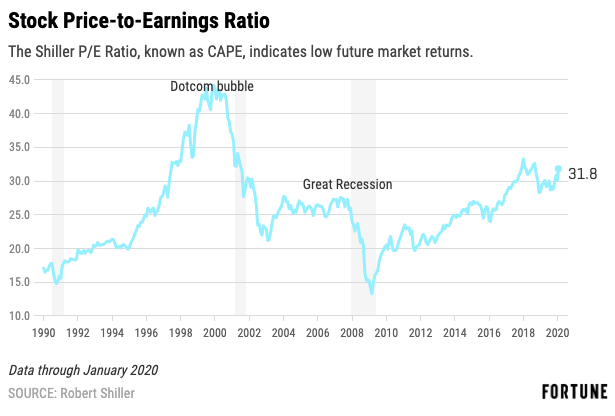
When the Shiller P/E Ratio gets high, it points to an overvalued stock market. The price-to-earnings ratio is above its pre-recession peak. However, it’s still below levels it hit before the dotcom bubble popped. Then again, it is higher now than it was leading up to Black Tuesday in 1929.
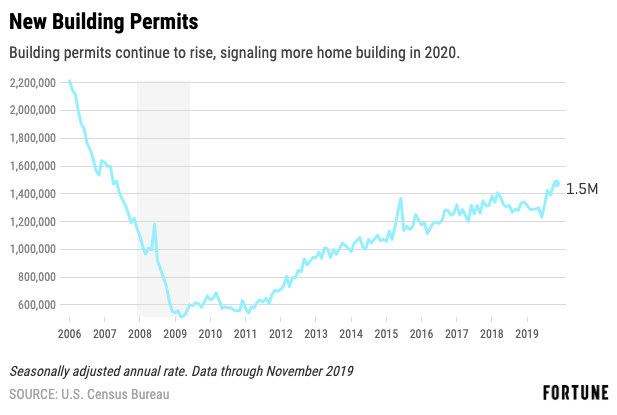
If we enter a recession in 2020, it’s unlikely it will come from the housing sector. Home price growth is moderate compared with insanely high bubble days, and homebuilding is steadily growing. And the recent uptick in permits suggest this will be a solid year for construction.
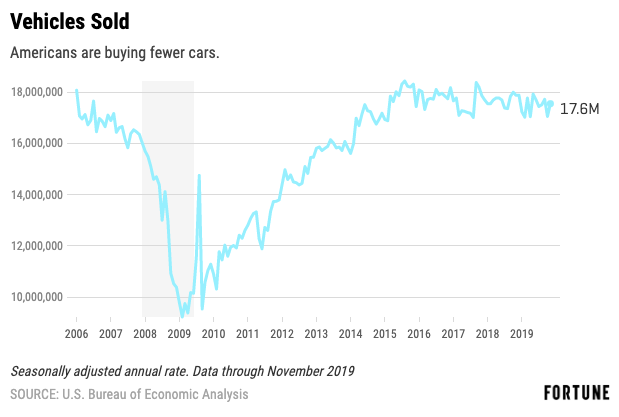
Americans are buying fewer cars. That’s bad news for firms like Ford and General Motors, and for U.S. auto plants and suppliers that are the backbone for huge swaths of the Midwest and South.
Now let’s look at our scorecard and see how these nine economic indicators are flashing. Cheat sheet: Green = signaling growth, yellow = steady, and red = forewarning trouble.
- Green: Two metrics (unemployment rate and building permits)
- Yellow: Five metrics (GDP growth, the yield curve, consumer confidence, stock price to earnings, and vehicle sales)
- Red: Two metrics (manufacturing purchasing managers index and business spend index)
The trajectory of the economy in early 2020 is pointing to neither a boom or a bust, but instead it looks like we’ll get more of the same: modest economic growth. Which, considering this bull market has run for more than a decade, is not a bad place to be.
More from Fortune’s investment guide:
—Start a donor advised fund for your charitable giving
—Goldman Sachs Asset Management’s Sheila Patel on her 2020 outlook
—5 pressing questions to hone your investment strategy this quarter
—Investors are uneasy over the surge of near-junk corporate bonds
—Chasing returns: 12 lessons for real estate investors
—10 stocks that are poised for a stellar 2020
Subscribe to Fortune’s Bull Sheet newsletter for no-nonsense finance news and analysis daily.