It all began with an anonymous Twitter handle named “Ivan the K.” The self-appointed “Lead Independent Director of Finance Twitter” had a dark theory in the depths of the pandemic. In 2020, they asked the universe, “Why is no one talking about a K recovery?” since there was much discussion at that time about an economic bounceback in the shape of either a U, an L, or, most bullish of all, a V. “Some things will bounce back,” Ivan wrote, “some will not recover. Think about it.”
Economists seem to have thunk on it and agreed: The K is real. It bears similarities to another saying, invented nearly 200 years earlier by the great English romantic poet Percy Bysshe Shelley: “The rich get richer, the poor get poorer.”
This is also called “the Matthew effect,” as some trace the sentiment all the way back to the bible’s Book of Matthew 25:29: “For to everyone who has, more will be given, and he will have abundance; but from the one who does not have, even what he has will be taken away.”
If you ask Mark Zandi, chief economist for Moody’s Analytics, this old-time religion got a new lease on life in the Reaganomics of the 1980s. “You really start to see this in the Reagan era,” Zandi told Fortune. “That’s when you get a structural divergence between productivity growth and median wage growth.”
Zandi argued that many elements combined then to weaken labor in favor of capital income: globalization, the decline of unions and manufacturing and major tax reforms. “The share of national income going to labor has been trending down since the early 1980s,” he said, “and the share going to capital owners—those who already have wealth—has gone up.”
So what is it about 2025, five years after the pandemic severed something economically, that accelerated both sides of the “K” for the wealthy and the poor?
Data don’t lie
First, consider the extraordinary surges in economic data seen, halfway through the 2020s. The stock market rallies have led to several record highs in 2025, incentivizing the (wealthier) Americans with money in the markets to loosen their purse strings. But the bottom half of the K is extending downwards, with fast-casual restaurants like Chipotle and Cava, and fast-food joints like McDonald’s, noting that lower-income customers, especially young people, are pulling back and preferring to dine at home.
Zandi’s own research has turned up some stunning results, notably that in the second quarter of 2025 the top 10% of wealthiest Americans were responsible for a whopping 49% of consumer spending. That means the economy has grown so lopsided—or K-shaped—that the richest Americans are responsible for half the economy. The K-shape is creating the illusion in economic data that despite sticky inflation and tariff-related sticker shock, consumer spending remains “resilient.”
Morgan Stanley Wealth Management’s Lisa Shalett has increasingly been sounding the alarm from her perch as chief investment officer. She told Fortune in an October interview that “the income inequality stuff is really getting like completely wackadoo,” specifically citing Zandi’s research: “That means 90% of the country is only half the consumption, I mean holy cannoli.”
Shalett covered the K-shaped economy specifically in a November 3 research note, in the context of whether 2026 marks an early or late stage of the economic cycle for investors. “Decoding this conundrum may hinge on the so-called K-shaped economy,” she wrote, “a concept that captures the widening chasm between the ‘haves’ and ‘have-nots.’”
Then Shalett said the situation is actually even worse than what Zandi produced: “For the U.S. consumer, wealth concentration has produced a situation where the top 40% of households by income account for approximately 60% of all spending; those households, in turn, control nearly 85% of America’s wealth, two-thirds of which is directly tied to the stock market, which has climbed more than 90% in three years.” She calculated that spending by the wealthiest households was growing 6x-7x faster than for the lowest cohort.
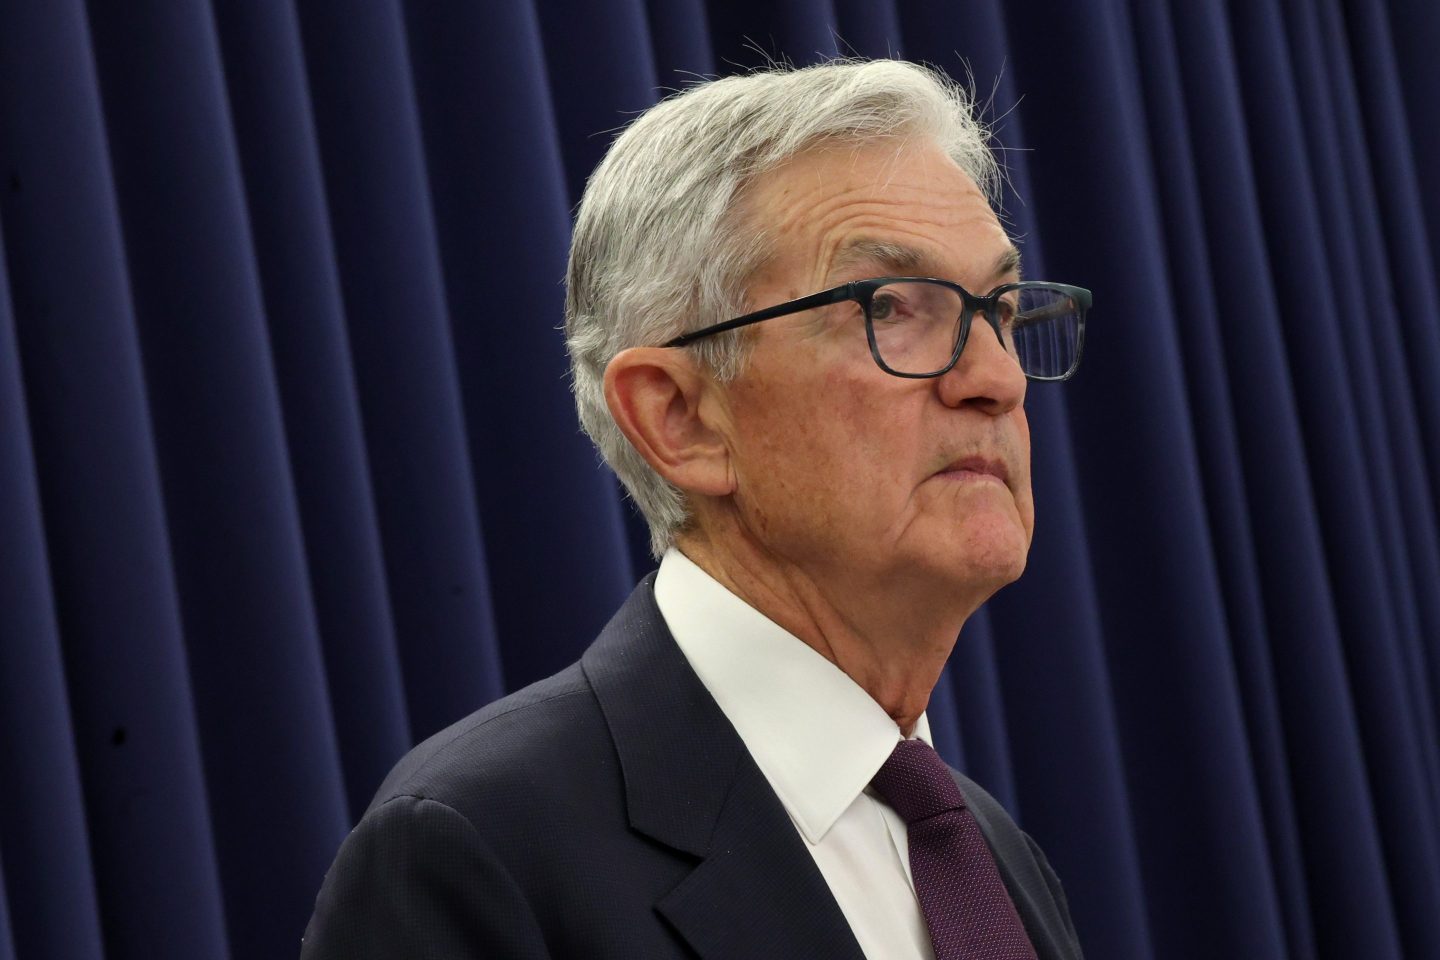
Even Federal Reserve chair Jerome Powell talked about seeing the pattern at October’s Federal Open Market Committee meeting. “If you listen to the earnings calls or the reports of big, public, consumer-facing companies, many of them are saying that there’s a bifurcated economy there and that consumers at the lower end are struggling and buying less and shifting to lower cost products,” Powell said last week. “But at the top, people are spending, at the higher income and wealth.”
When did the K-shaped economy emerge?
The concept of a bifurcated economy has been baked into American society longer than even the days of Reagan, according to Tyler Schipper, associate professor of economics at the University of St. Thomas.
“There’s this underlying thing that has been true for decades and decades and decades,” Schipper told Fortune. “Number one, lower income households always struggle more in the economy. They tend to be more impacted by price changes because they’re spending a higher percentage of their income.
“And second, that it tends to be that after each recession, lower income workers fall further behind in the income distribution,” he added.
Today, conversations around the shape of the American economy are more urgent because more of the middle class—and those making about $100,000 per year—are getting pushed into the lower half of the K, Schipper said. This can be seen in mid-income and higher-income earners flocking to discount retailers like Walmart and Dollar General. It can even take on more absurd forms, with “Ralph Lauren Christmas” trending at unprecedented levels heading into the projected $1 trillion 2025 holiday season, but TikTok and Instagram full of tips on how to achieve the look of red-tartan-plaid and cozy sweaters on a budget—in other words, not at an actually expensive Ralph Lauren store.
Why is this happening?
That lower half of the K is extending ever downward as the consumer encounters a unique set of challenges, including the inflationary impact of tariffs, according to Schipper. Lower-income households tend to spend more on essential goods more likely to be impacted by tariffs. The Yale Budget Lab calculated that the levies impact the bottom of the income ladder more than three times more than the top.
A low-fire, low-hire labor market has also contributed to evidence of a two-tiered economy, said Claudia Sahm, chief economist at New Century Advisors and a former Federal Reserve economist. While tech layoffs have been top of mind following massive cuts from Amazon, layoff rates are still low, Sahm told Fortune, meaning if you have a job, you may feel more financially secure. If you’re just entering the job market like Gen Z is, you may have a hard time finding a job as firms contract following a post-COVID hiring spree, and as AI begins to displace entry-level jobs. To be sure, data from Challenger, Gray & Christmas released on Thursday found U.S. employers cut more than 150,000 jobs last month, the largest October reduction in two decades.
But another part of the resurgence of discussions about a bifurcated economy comes from the relative nature of a K-shaped economy, according to Schipper. While the economy has historically been two-tiered, diverging consumer sentiment has also contributed to a narrative that two income groups are moving away from each other.
For example, in 2022 when the stock market declined, consumer sentiment in both the top-third and bottom-third of income levels converged, according to data from the University of Michigan’s Survey of Consumers. A similar pattern occurred in April, when the announcement of Liberation Day tariffs spooked Americans across income levels, Schipper noted. Last month, however, consumer attitude toward the economy saw a greater split, with low-income Americans feeling far less confident about the economy than those high-income.
How monetary policy created the two-tiered economy
Some economists point to the widening divide between the rich and the poor as a consequence of monetary policy. The Fed, over the past few years, has had a historic tightening cycle – eleven rate hikes between 2022 and 2024—which was meant to pare down inflation. However, it also reinforced the split since wealthy households, flush by years of asset appreciation, could weather the slowdown better than lower income households facing higher mortgage rates and shrinking credit, Zandi said.
Cheap money in the 2010s and early pandemic years boosted stocks and home values, but the 2022-and-on tightening squeezed borrowers and renters without necessarily reversing those gains. That means even as inflation has cooled, the damage lingered as asset holders retained their windfall but wage earners bore the brunt of disinflation.
“Folks in the top third of the income and wealth distribution are doing well, but the remaining two-thirds of Americans are struggling… they borrowed during the pandemic when rates were low, and now they’re having to pay on that debt at a higher rate,” Zandi said.
How can the economy become less bifurcated?
Though Fed chair Powell has acknowledged today’s K-shaped economy, a restrictive monetary policy is helping keep it in place, Sahm argued, making it unlikely for the two diverging K lines to come any closer together.
“We have a Fed that’s still trying to fight inflation that’s been elevated, and part of the tool that they have for fighting inflation is interest rates are elevated, and they’ve been elevated for some time,” Sahm said. “This is the way restrictive monetary policy works: It’s going to hit households hardest who are more financially constrained.”
Zandi had a different perspective. He argued that the gap will require policy changes far beyond the Fed’s remit.
“The Fed can’t fix the K-shaped economy,” he said. “It can only stabilize prices and employment. The distributional effects are up to fiscal policy.” Instead, Zandi argued for a reversal of some choices made on the fiscal side that would “do no harm” to lower-and-middle-income Americans.
“Don’t impose tariffs—that exacerbates inequality,” he said. “Lower- and middle-income households spend a much higher share of their budget on imported products like food, clothing, and cars.”
He also criticized President Donald Trump’s “highly restrictive” immigration policy, which he said hurts jobs for industries that rely on immigrants, such as construction, agriculture and manufacturing broadly.
Beyond just addressing self-inflicting wounds, Zandi argued that progress depends on both structural and cyclical forces: raising productivity through education, broad-based jobs creation, and ensuring that gains from AI will be equally shared. “If the benefits of AI are distributed more broadly,” he said, “and if job losses are offset by new opportunities, we’ll be fine.”
What’s so bad about a K-shaped economy?
Clear evidence of a two-tiered economy doesn’t mean a recession is imminent, economists said. It does, however, mean that if economic indicators were to take a nosedive, the risk of a recession would increase.
“The K-shaped economy, the bifurcated economy, is potentially a more vulnerable economy,” Sahm said.
Though layoff rates are still relatively low, if the rate of job cuts increased, there would be many more people in a job market where there’s not much hiring. The labor market today doesn’t look like it did in the job-hopping era of 2023, even when interest rates were still high, Sahm noted. Right now, only the healthcare and hospitality sectors are adding jobs in earnest, creating a concentration of growth not optimal for economic stability.
“Anytime you have that, you’re more vulnerable if something bad happens,” Sahm said.


