The energy infrastructure company Sempra was formed by the 1998 merger of Pacific Enterprises, the parent company of Southern California Gas, and Enova, parent of San Diego Gas & Electric. Sempra operates through three business lines: Sempra California provides energy to consumers in Southern and Central California through utilities SDG&E and SoCalGas. Sempra Texas includes Oncor Electric Delivery, an electric transmission and distribution utility. And Sempra Infrastructure develops, builds, and operates energy infrastructure. The company was previously known as Sempra Energy and rebranded to Sempra in 2021.
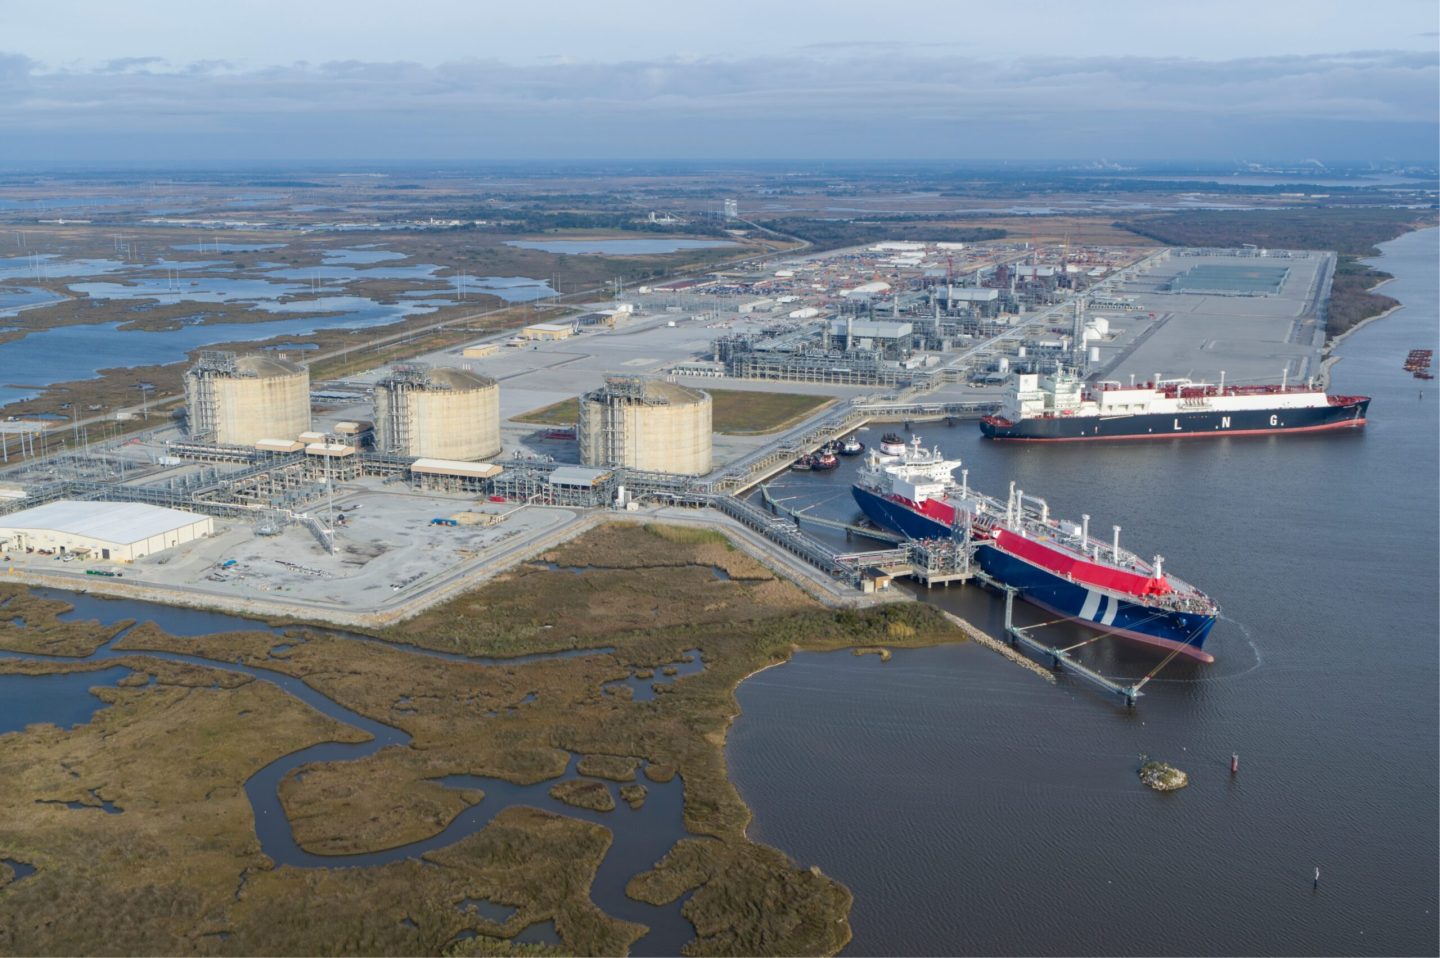
Courtesy of Sempra