RTX, an aerospace and defense company, provides systems and services for commercial, military, and government customers in the United States and internationally. It operates through three firms: Collins Aerospace, Pratt & Whitney, and Raytheon. The Collins Aerospace Systems segment designs, produces, and supports cabin interiors, including oxygen systems, food and beverage preparation, storage and galley systems, and lavatory and wastewater management systems; battlespace, test and training range systems, crew escape systems, and simulation and training solutions. Pratt & Whitney supplies aircraft engines for commercial, military, business jet, and general aviation customers; and produces, sells, and services military and commercial auxiliary power units. Raytheon provides defensive and offensive threat detection, tracking, and mitigation capabilities for U.S., foreign government, and commercial customers. The company, incorporated in 1934, was formerly known as Raytheon Technologies Corp. and changed its name to RTX Corp. in July 2023.
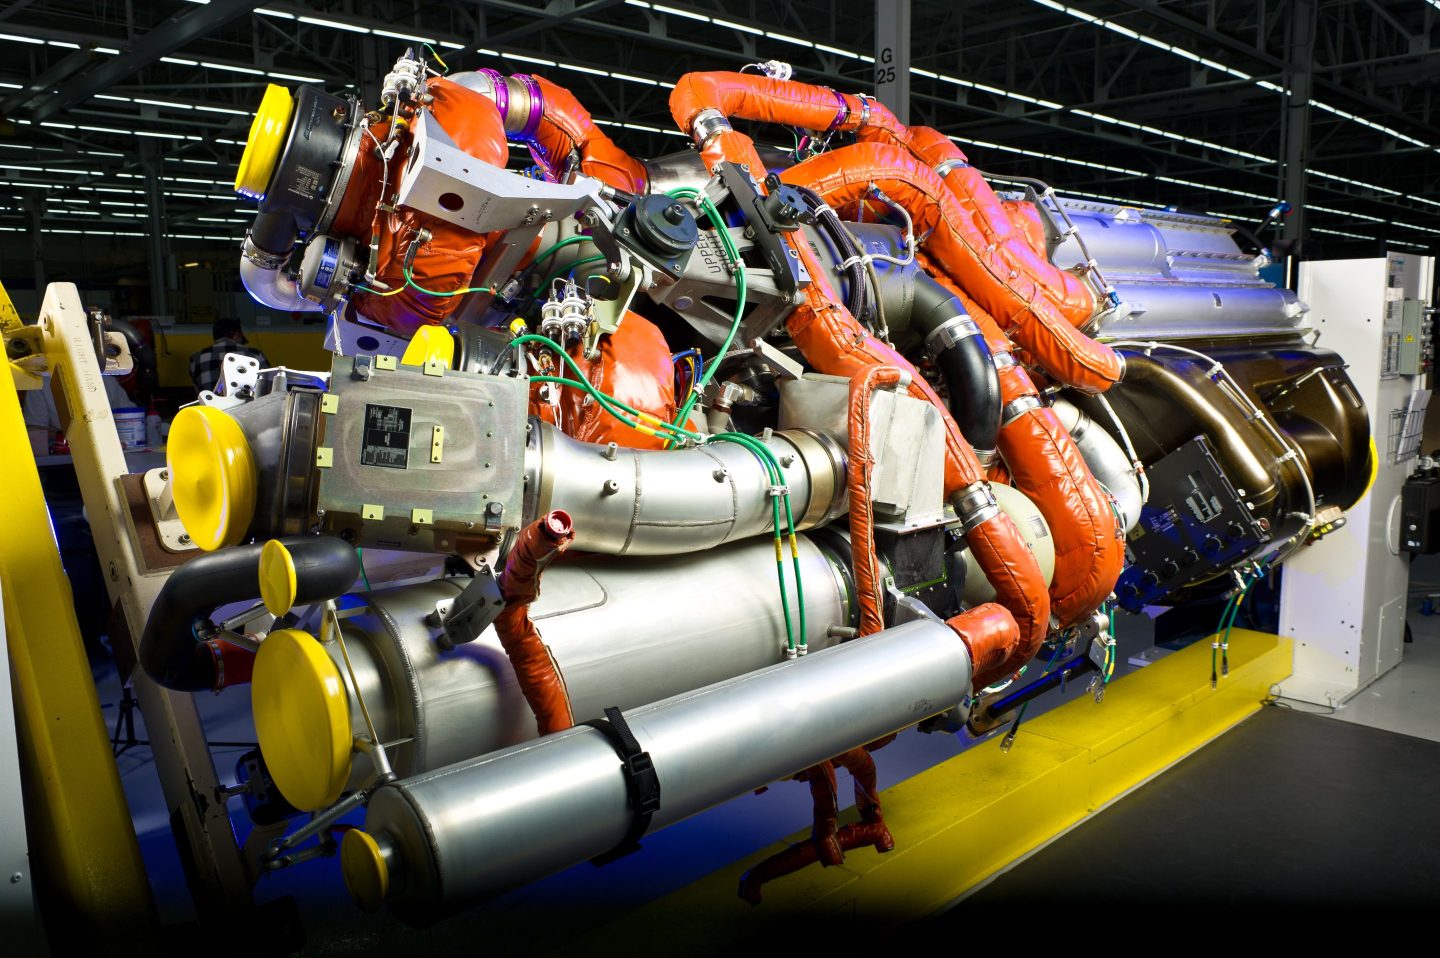
Courtesy of RTX