Nvidia is a leading producer of chips used in artificial intelligence and, therefore, has become a critical component in the business sectors that its products power. In 2026, Nvidia has solidified its position as the most valuable company in the world. In recent years, the company has become the top supplier of chips used in data centers for the data-intensive job of training and running AI models. Nvidia is also a big seller of graphics chips for video game consoles and high-end personal computers, and chips used by the automotive industry in new cars. Nvidia was incorporated in 1993.
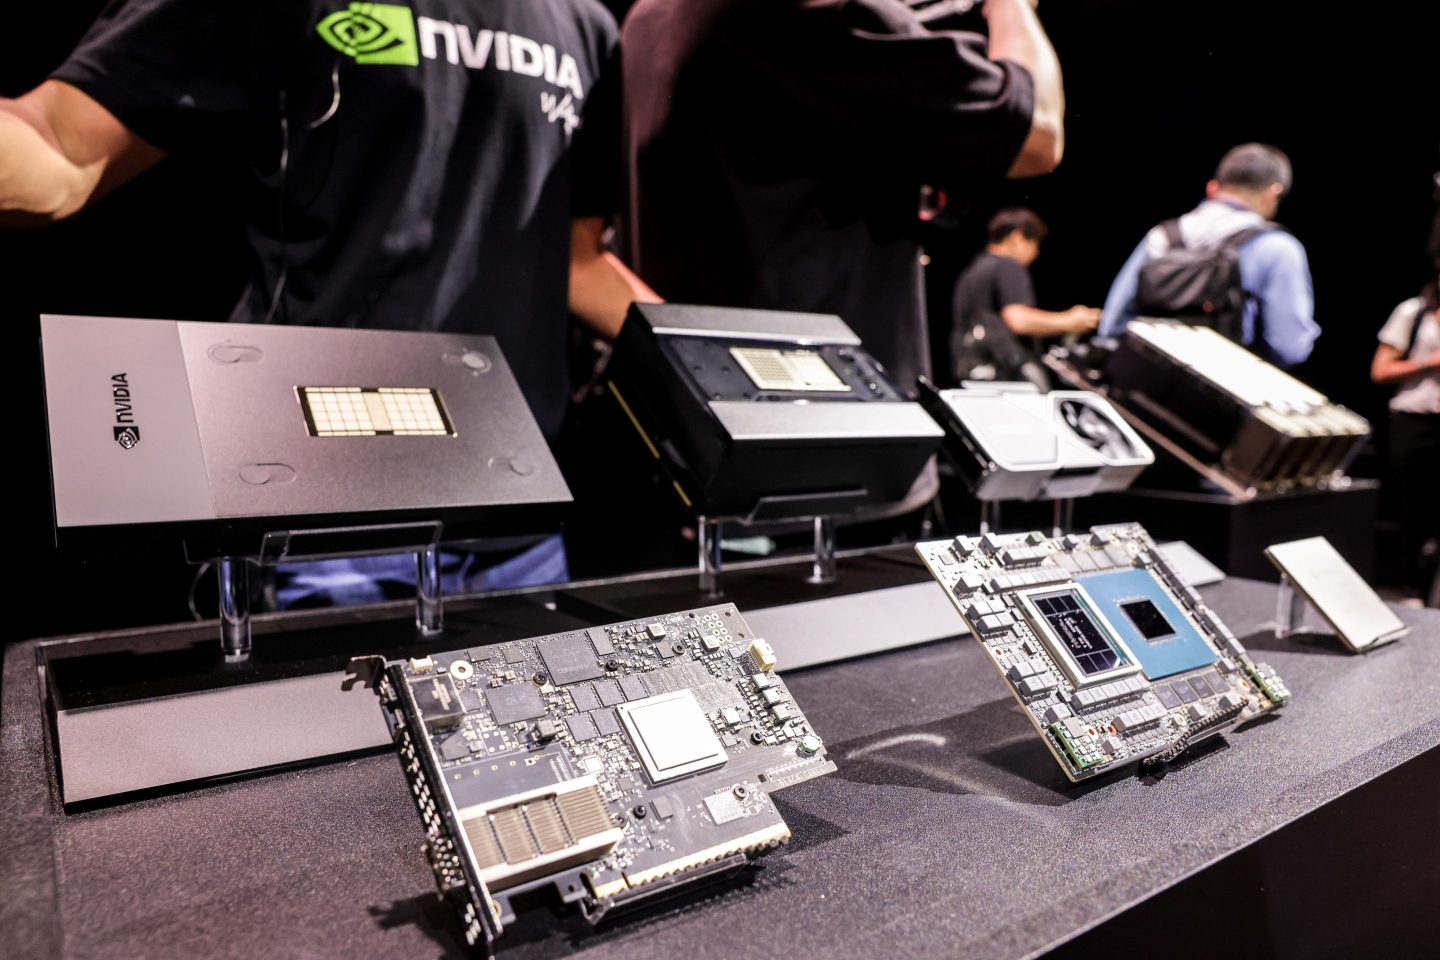
I-Hwa Cheng—Bloomberg/Getty Images