The U.S. housing market has long been seen as an inflation hedge. Look no further than the 1970s, a decade notoriously known for out-of-control inflation. During that 10-year window, the consumer price index soared 106%. At the same time, the S&P 500 index—whose members saw inflation eat away at their margins—climbed a measly 14%. Homeowners did much better: The median sales price of U.S. homes jumped 167% during the ’70s.
While home prices have historically performed well during inflationary periods, it doesn’t guarantee it’ll happen this time around. After all, rapid home price growth during the pandemic has already created an affordability crunch for homebuyers.
That said, no matter how home prices perform this decade, we do know results won’t be uniform nationwide. The varying degree of supply constraints and population growth across the country means home price appreciation should also vary—by a lot.
To identify the housing markets with the most growth upside through the remaining years of the decade, Fortune teamed up with Home.LLC, a startup that provides down payment assistance to homebuyers in return for a share of any profits. Over the past six months, data scientists at Home.LLC helped us build a forecast model to not only estimate home price appreciation potential (i.e., our Return Score) but also assess markets’ risk factors (i.e., our Risk Score). In total, we looked at the 100 largest metropolitan statistical areas in the nation.
We weighted 60% on the Return Score and 40% on the Risk Score to build our final ranking of the 10 housing markets likely to see home prices rise the most by 2030.
Before we show you our top 10 list, let’s take a deeper look at the data.
Fortune’s goal wasn’t to predict the rate of home price growth in America’s largest housing markets, instead it was to find those with the most upside for growth (our Return Score). After running the numbers, we grouped markets into three tiers based on their appreciation upside: high returns, moderate returns, and low returns.
To calculate the Return Score, we factored in 23 data points, measuring core figures like projected income growth and projected population growth through 2030. In addition, we looked at things like property crime levels, affordability, climate risks, and share of residents with a bachelor’s degree or higher. Those latter factors have historically correlated with home price appreciation. (To see a full list of weights used in our Return Score, go here).
Fortune could have produced a ranking simply looking at growth potential (our Return Score). However, that alone would overlook the potential for a correction in the housing market. While extremely rare (home prices have declined only two times over the past 100 years), we still thought it would be wise to assess market risk (our Risk Score).
Ironically, the markets with the highest market risk are also some of the fastest growing. The reason? Housing markets with high levels of homebuilding have the highest risk of getting oversupplied in the scenario that housing slumps. When the housing bubble burst in 2008, Phoenix and Las Vegas quickly saw their fast-growing markets flip from construction frenzies into supply gluts that lasted for years.
To calculate the Risk Score, we factored in 14 metrics: among them, building permits, land use restrictions, delinquency rates, housing inventory, and average home tenure. (To see a full list of weights used in our Risk Score, go here.) And to be clear: A high Risk Score in our model is actually a good thing—it means an area has a lower chance of getting oversupplied during a downturn.
Above, we’ve plotted the Return Score and Risk Score for America’s 100 largest housing markets. The higher the Return Score, the more upside for home price growth between now and 2030. While a higher Risk Score indicates a market that would be less negatively impacted by a housing slump. The top right quadrant—where risk is low and growth potential is high—are the markets with the best of both worlds.
When it comes to home price growth potential, San Jose and Austin have similar outlooks with their Return Scores coming in at 61.3 and 61, respectively. But the risk profiles are very different. Homebuilders like Lennar and D.R. Horton are busy building sprawling subdivisions all around the Austin metropolitan area. Meanwhile, San Jose has scant new construction. That explains why Austin’s Risk Score (46.6) is more concerning than San Jose’s (74.6). If a housing correction comes to fruition, Austin has a much higher chance, according to our model, of temporarily becoming oversupplied. The same goes for fast-growing markets in states like Florida and Georgia.
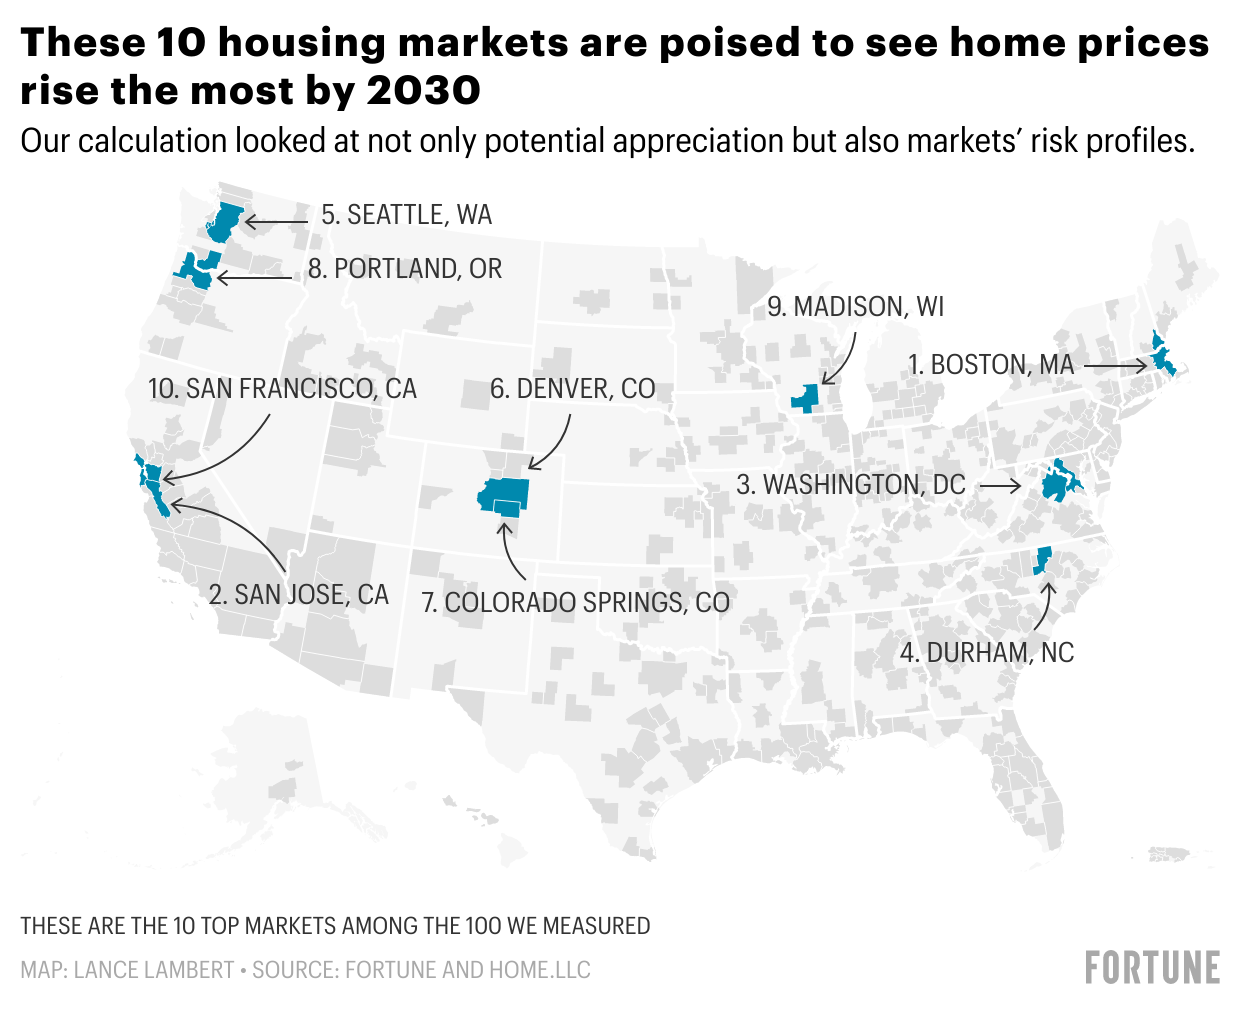
After factoring in both our Return Score and Risk Score, we built our list of the top 10 housing markets likely to see home prices rise the most by 2030. Or more accurately put: a ranking of the regional housing markets with the best risk-adjusted profiles for elevated home price growth.
At No. 1 was Boston. Not only are incomes in Boston expected to rise considerably, but the market has very low levels of homebuilding. Of course, tight supply in the face of rising incomes is the perfect recipe for higher home prices.
Behind Boston is San Jose (No. 2); Washington, D.C. (No. 3); Durham, N.C. (No. 4); Seattle (No. 5); Denver (No. 6); Colorado Springs (No. 7); Portland, Ore. (No. 8); Madison (No. 9); and San Francisco (No. 10).
Interestingly, this model shows precisely the opposite of what many media narratives have painted: that people are fleeing expensive cities so prices there are likely to fall. In fact, this data shows the opposite: If building is subdued and incomes keep rising, by 2030 markets like San Francisco, Seattle, and D.C. will likely outpace the pack.
If you’d like to learn more about the analysis conducted by Fortune and Home.LLC (or to find more detailed data on a particular market) we put the full data set up at this link.
Never miss a story: Follow your favorite topics and authors to get a personalized email with the journalism that matters most to you.


