
This week China announced weak reforms for its massive state-owned companies that are the latest evidence that President Xi Jinping is not liberalizing the country’s economy like many pundits a few years ago hoped he would.
We covered yesterday why expectations for real reforms were too optimistic.
But why are massive changes needed anyway?
This chart from Capital Economics shows the dreary state of industrials under state ownership.
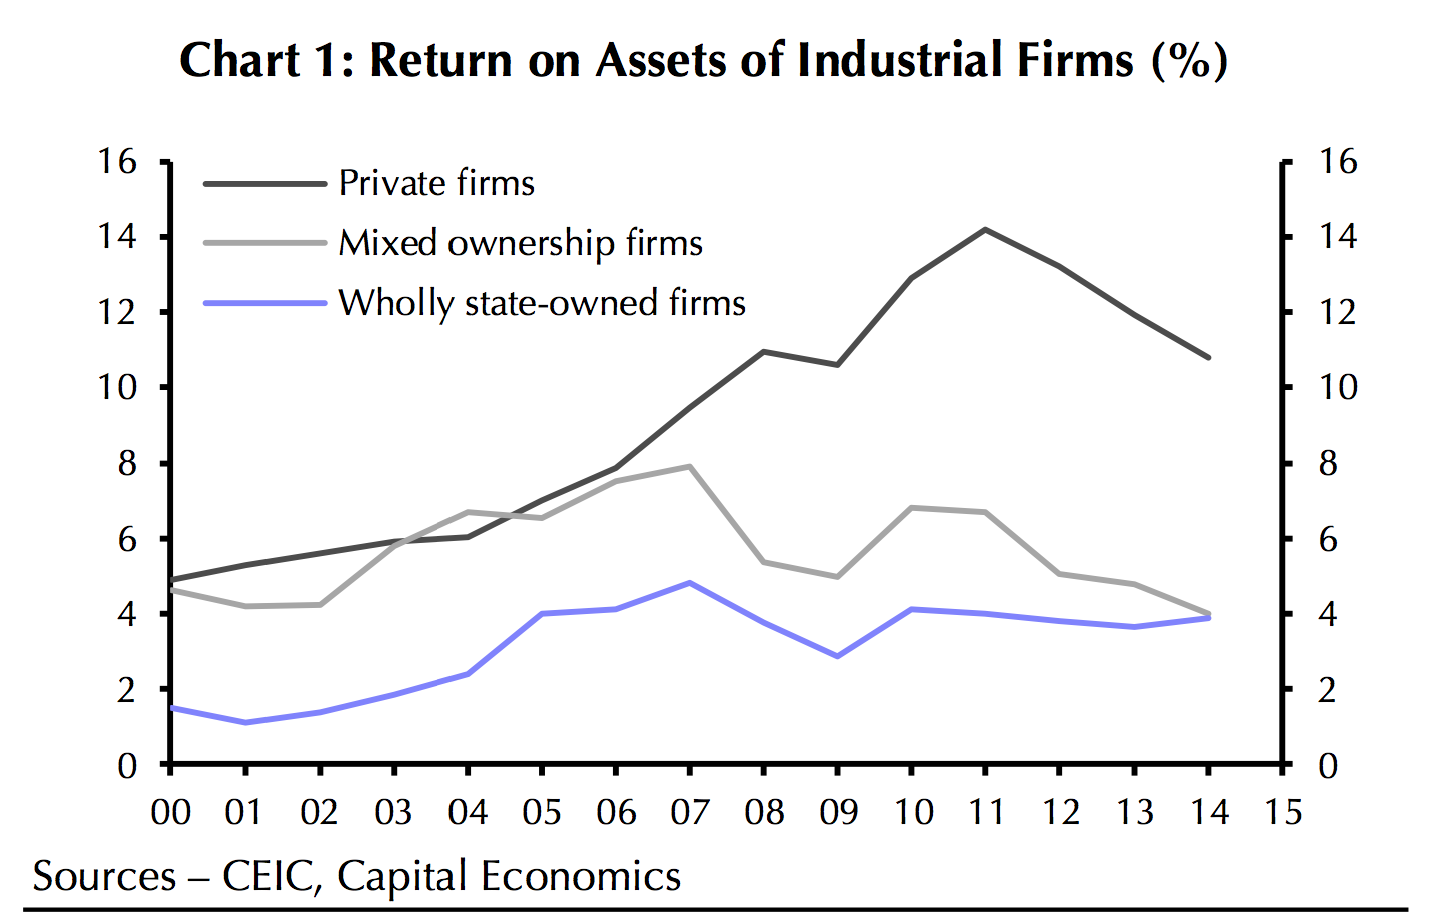
These are the same firms experiencing recession in areas of China’s ‘Rust Belt,’ where the old Soviet-style state-owned industry is suffering.
It gets worse when you expand to include almost all the country’s state-owned industries.

The chart from Gavekal Dragonomics shows the 115 or so centrally-run companies—the oil, steel, and auto conglomerates that dominate the top of the Fortune Global 500 list—faring the best. But China has another 80,000 smaller SOEs run by local governments. They barely earn an ROA above 1.5%.
The charts explain why the latest tepid SOE reforms were so disappointing for economists expecting China to give its lagging state-run sector a boost.


