Vistra is a power-generation company that operates across the U.S., with a particularly strong concentration in Texas. It specializes in producing and selling electricity for residential and commercial customers; it also provides power for AI data centers. Vistra’s portfolio includes natural gas and nuclear power plants, coal-powered facilities, and solar power, as well as battery storage for energy. The company changed its name from Vistra Energy to Vistra in July 2020.
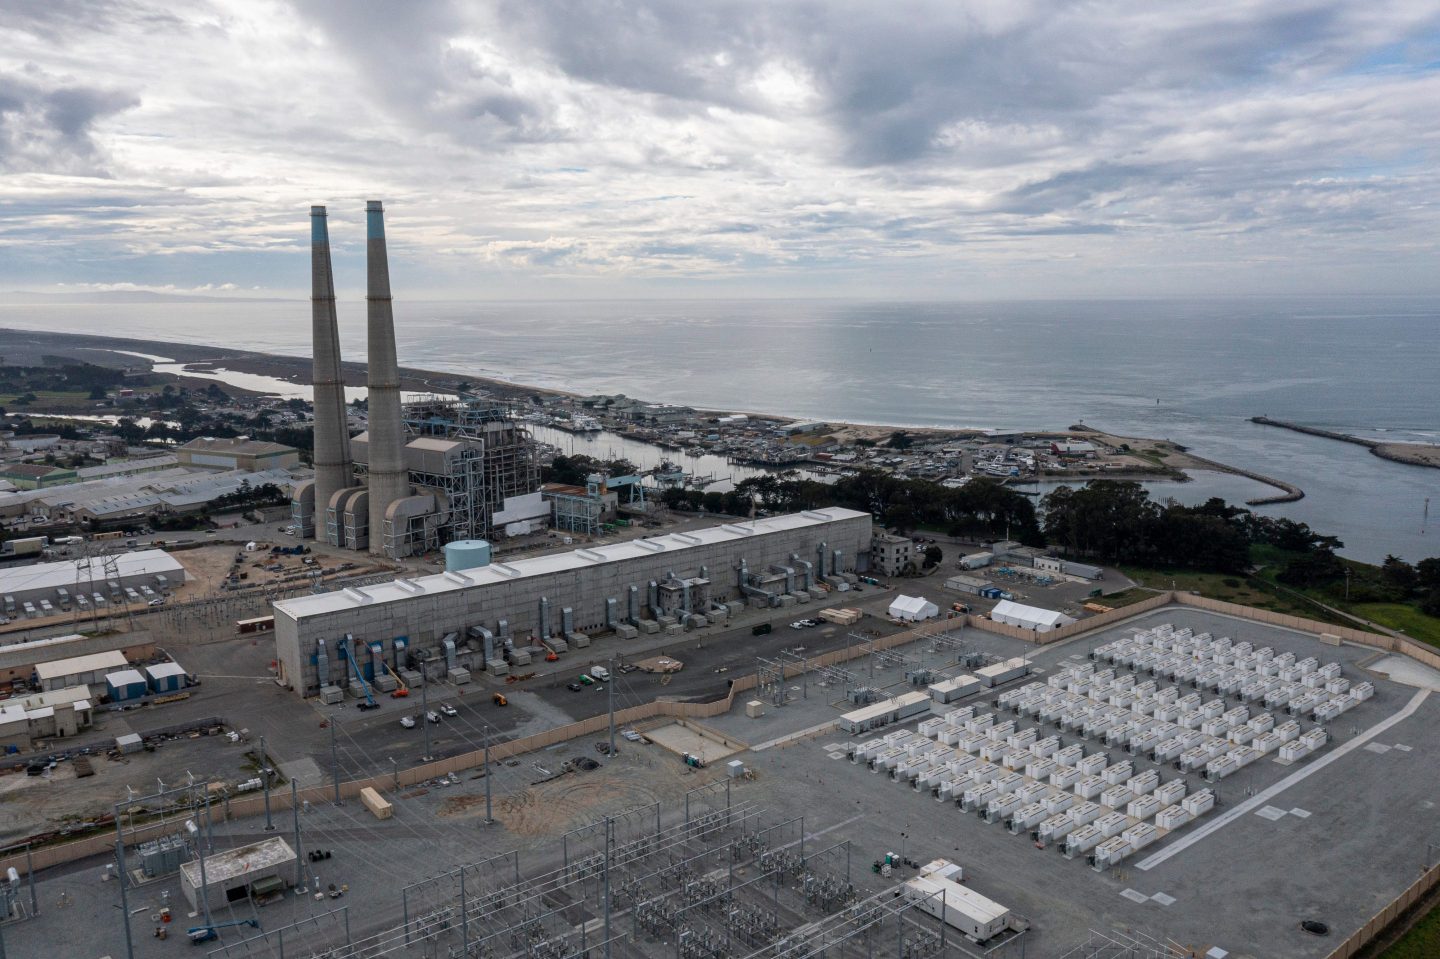
David Paul Morris—Bloomberg/Getty Images