PulteGroup is one of the largest homebuilders in the U.S., having constructed over 800,000 homes since 1950. The company operates in more than 45 markets across 24 states through its portfolio of brands, including Centex, Pulte Homes, Del Webb, DiVosta Homes, American West, and John Wieland Homes and Neighborhoods.
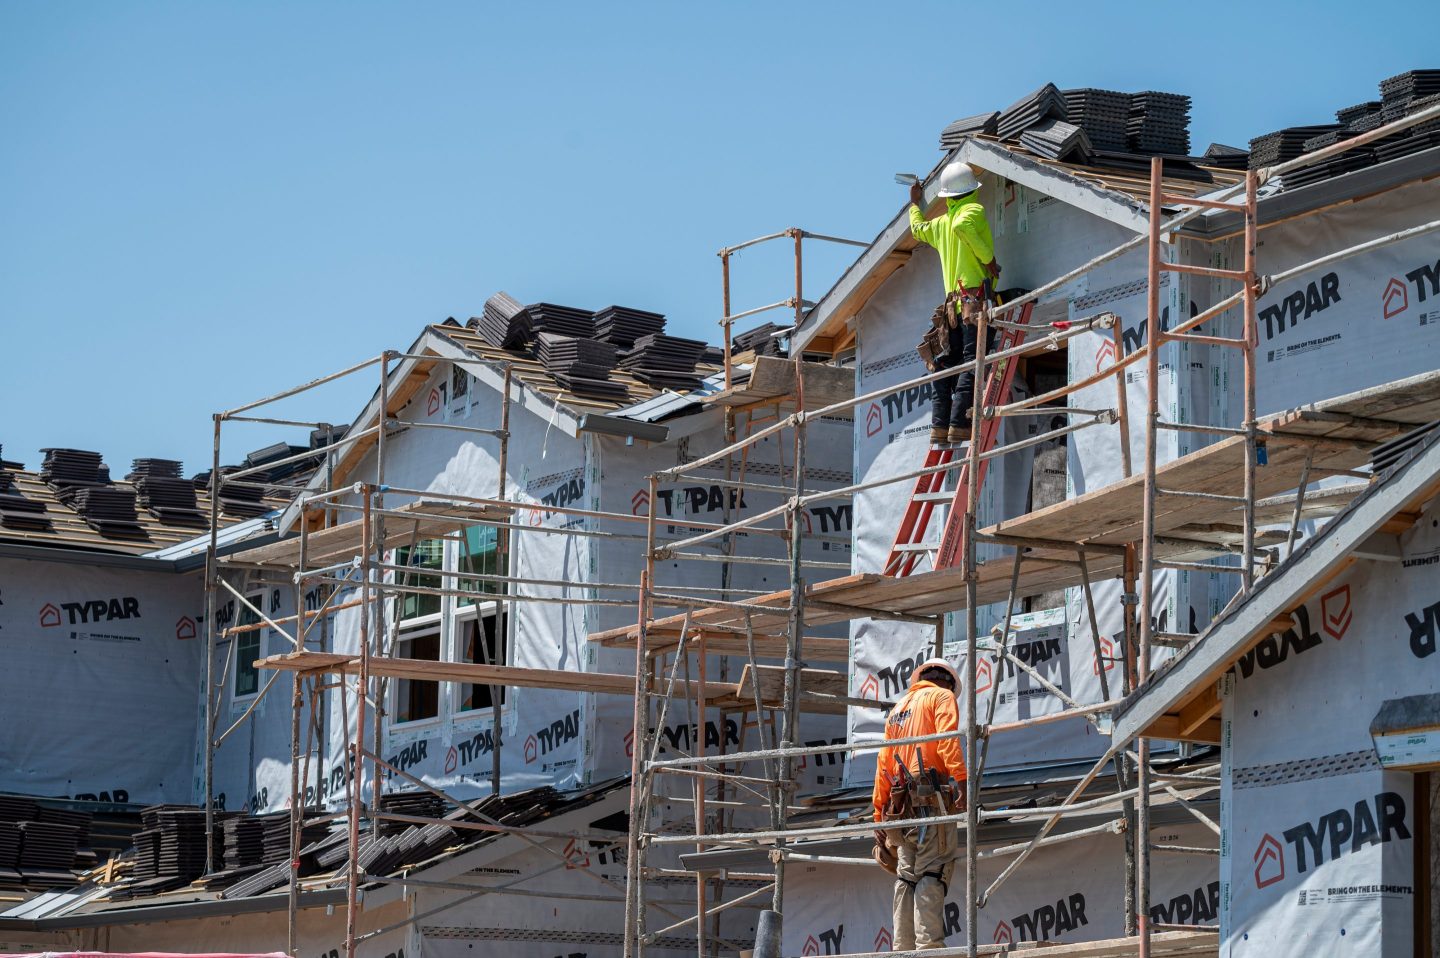
David Paul Morris—Bloomberg/Getty Images