Founded over 140 years ago, Kiewit is an engineering and construction company serving various sectors across North America. It has been responsible for projects—from ideation to construction execution—in areas like transportation (roadways and bridges), water (treatment and wastewater facilities), and power (dams and substations).
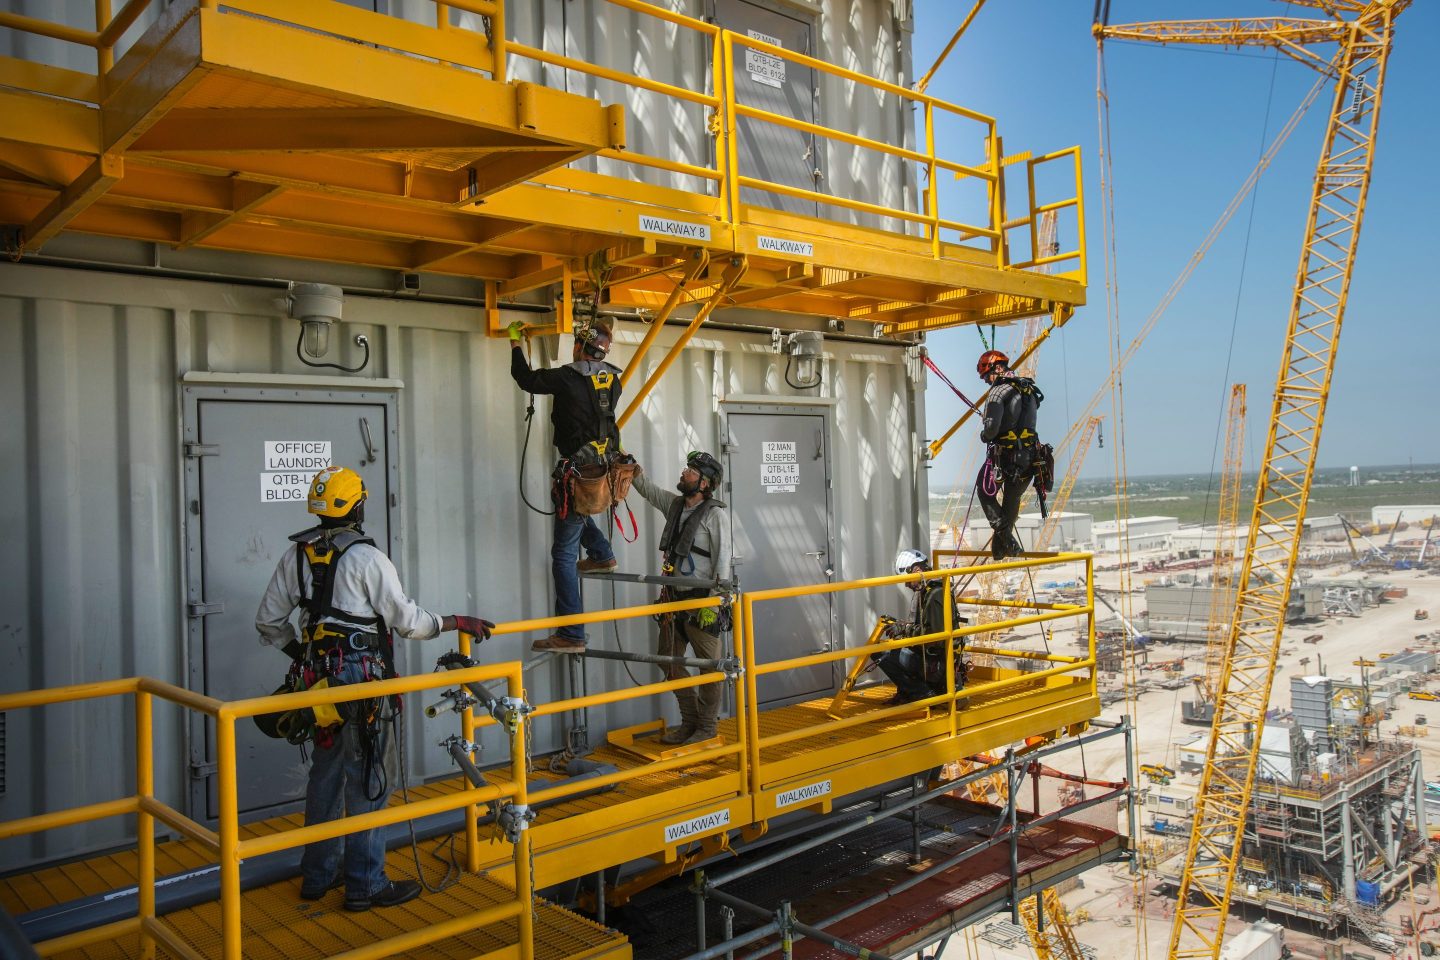
Brett Coomer—Houston Chronicle/Getty Images