Par Pacific operates refineries in four states (Hawaii, Washington, Wyoming, and Montana) that, depending on the location, produce gasoline, asphalt, marine fuels, and crude oil. The company also has dozens of gas stations under the Hele, 76, and Nomnom brands in Hawaii, Washington, and Idaho, along with a pipeline network and marine terminals. Originally known as Delta Petroleum, then Par Petroleum, it took its current name in 2015.
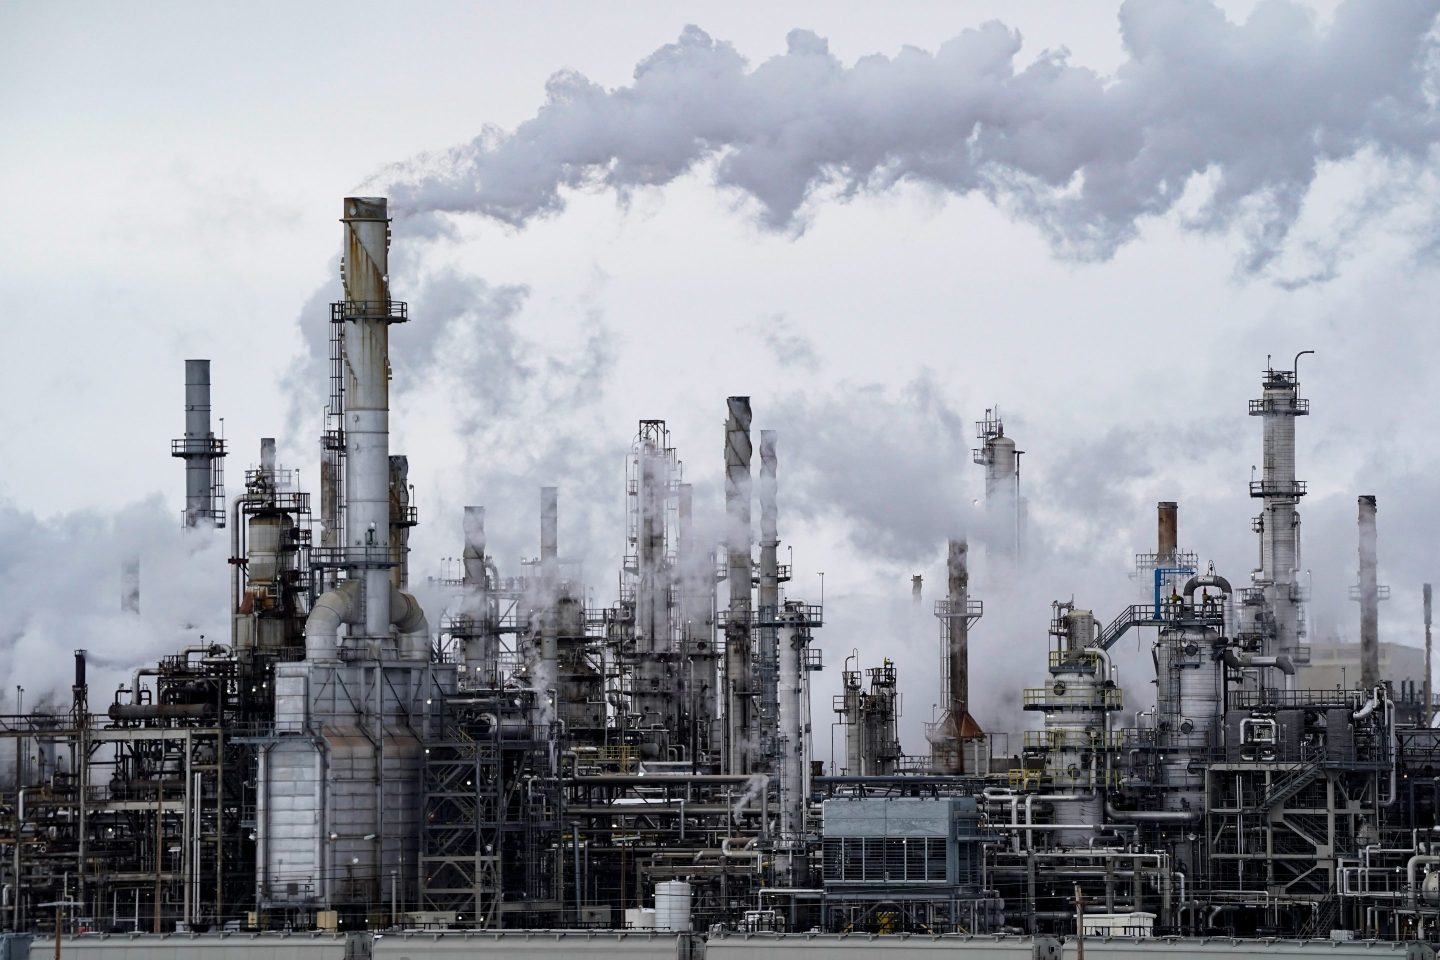
Bing Guan—Bloomberg/Getty Images