A 100-year-old company that started out as Florida Power & Light, NextEra Energy has grown into one of the largest energy infrastructure development companies in the U.S. NextEra provides a diverse mix of power generation, including natural gas, nuclear, renewable energy, and battery storage. Its legacy FPL subsidiary remains the nation’s largest electric utility with 12 million Florida customers. But the businesses for wind, solar, and batteries have expanded to nearly 45 states and Canada with projects either in operation or under development.
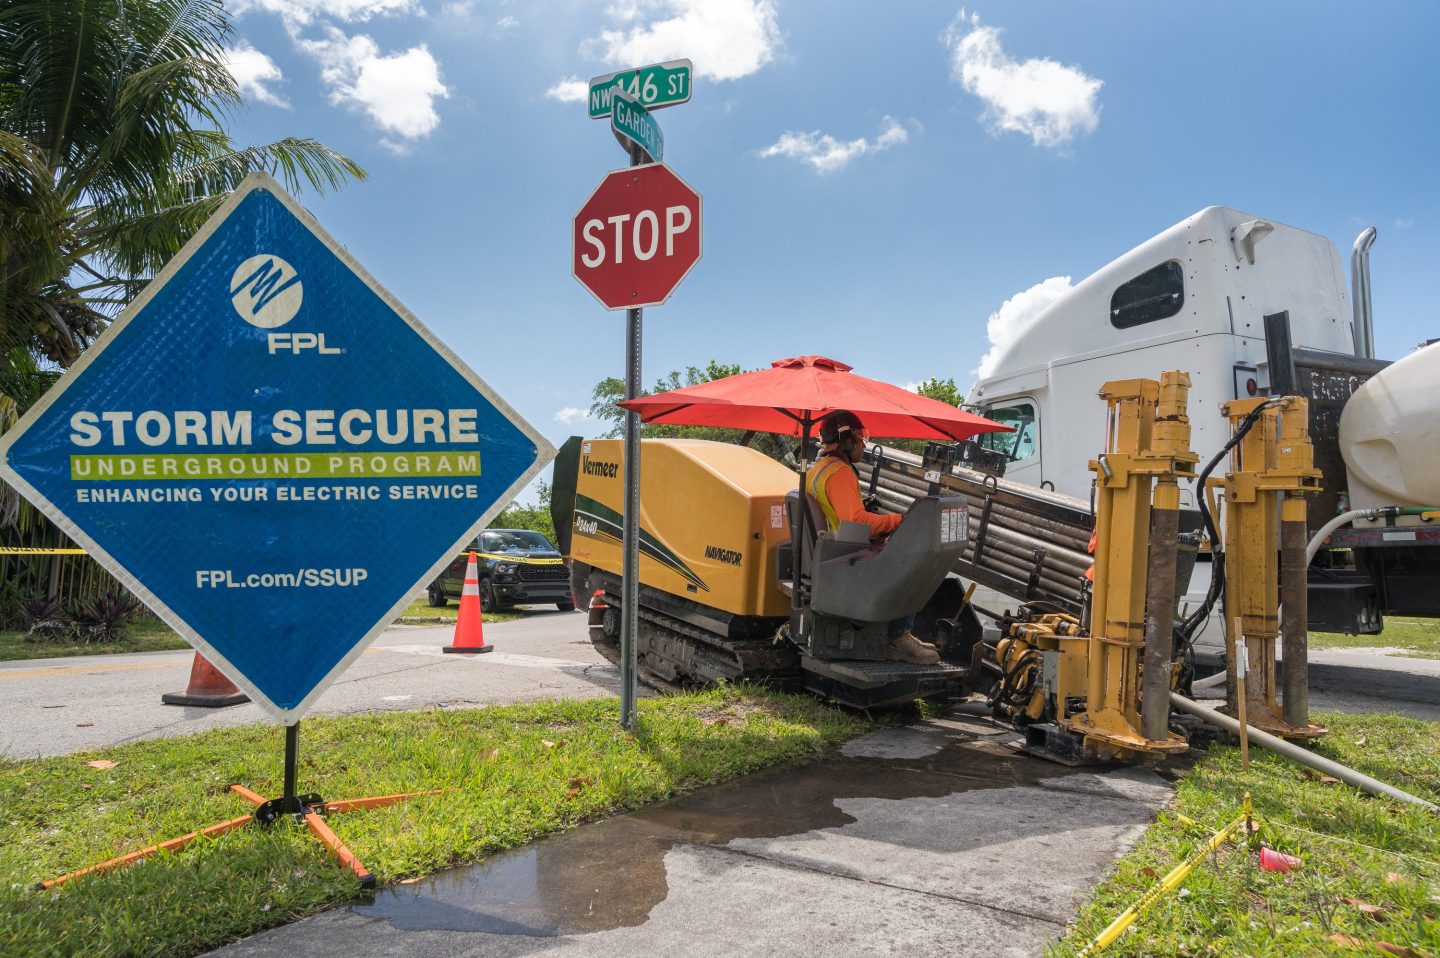
David Adame—FPL/NextEra Energy