MasTec is an infrastructure construction company operating primarily in the U.S. and Canada. The company builds infrastructure for wireless and wireline/fiber communications, clean energy, pipeline infrastructure, power delivery services such as electrical and gas transmission, industrial and heavy civil infrastructure, and water infrastructure. MasTec’s customers are in utilities, communications, and government.
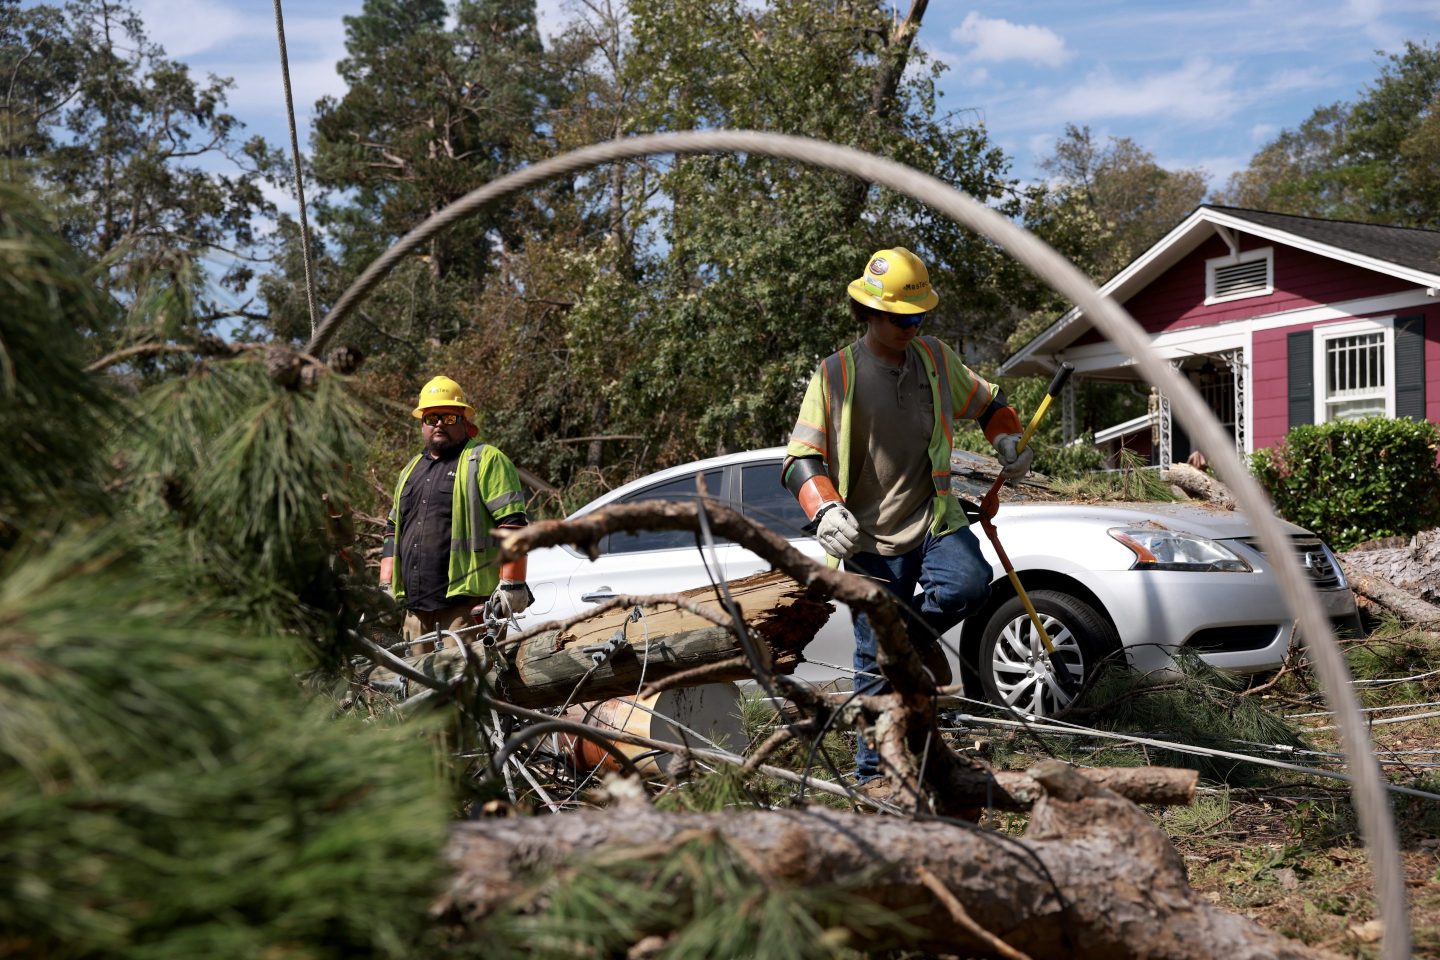
Joe Raedle—Getty Images