Marvell Technology was founded in 1995 in Santa Clara, California, originally to design silicon for hard-disk drive read channels. Over time, it evolved from a storage-focused chip maker into a leading fabless semiconductor company centered on data infrastructure. Today, Marvell designs custom silicon for compute, connectivity, storage, and security, serving cloud, carrier, enterprise, automotive, and industrial customers. Its portfolio includes networking processors, switches, Ethernet controllers and PHYs, optical interconnects, SSD and HDD controllers, and related system solutions.
Marvell Technology
Marvell Technology in Fortune Rankings
- About
- Great Place to Work
- Earnings Reports
Best Workplaces in Engineering 2026
Employees say:
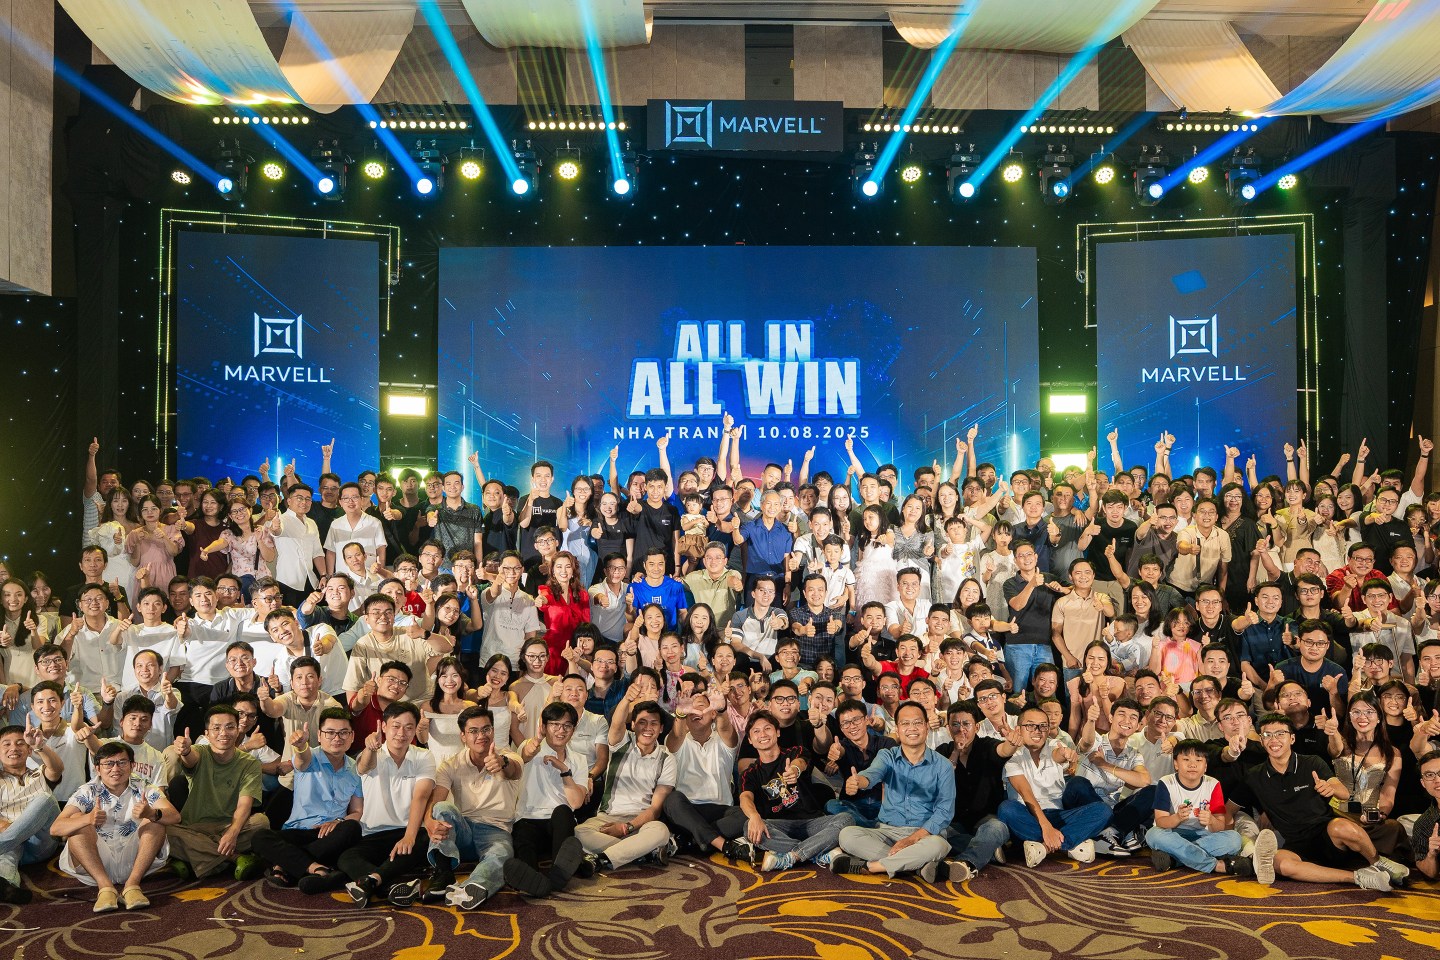
"We have Visionary Leadership that has an inspiring ring to it. Marvell is very much a culture that fosters individual growth among its employees and one that celebrates innovation, learning, and execution. The many company wide and local events such as MEET, CONNECT and Town Hall style meetings makes the company seem smaller than it is and helps break down siloes between different groups."
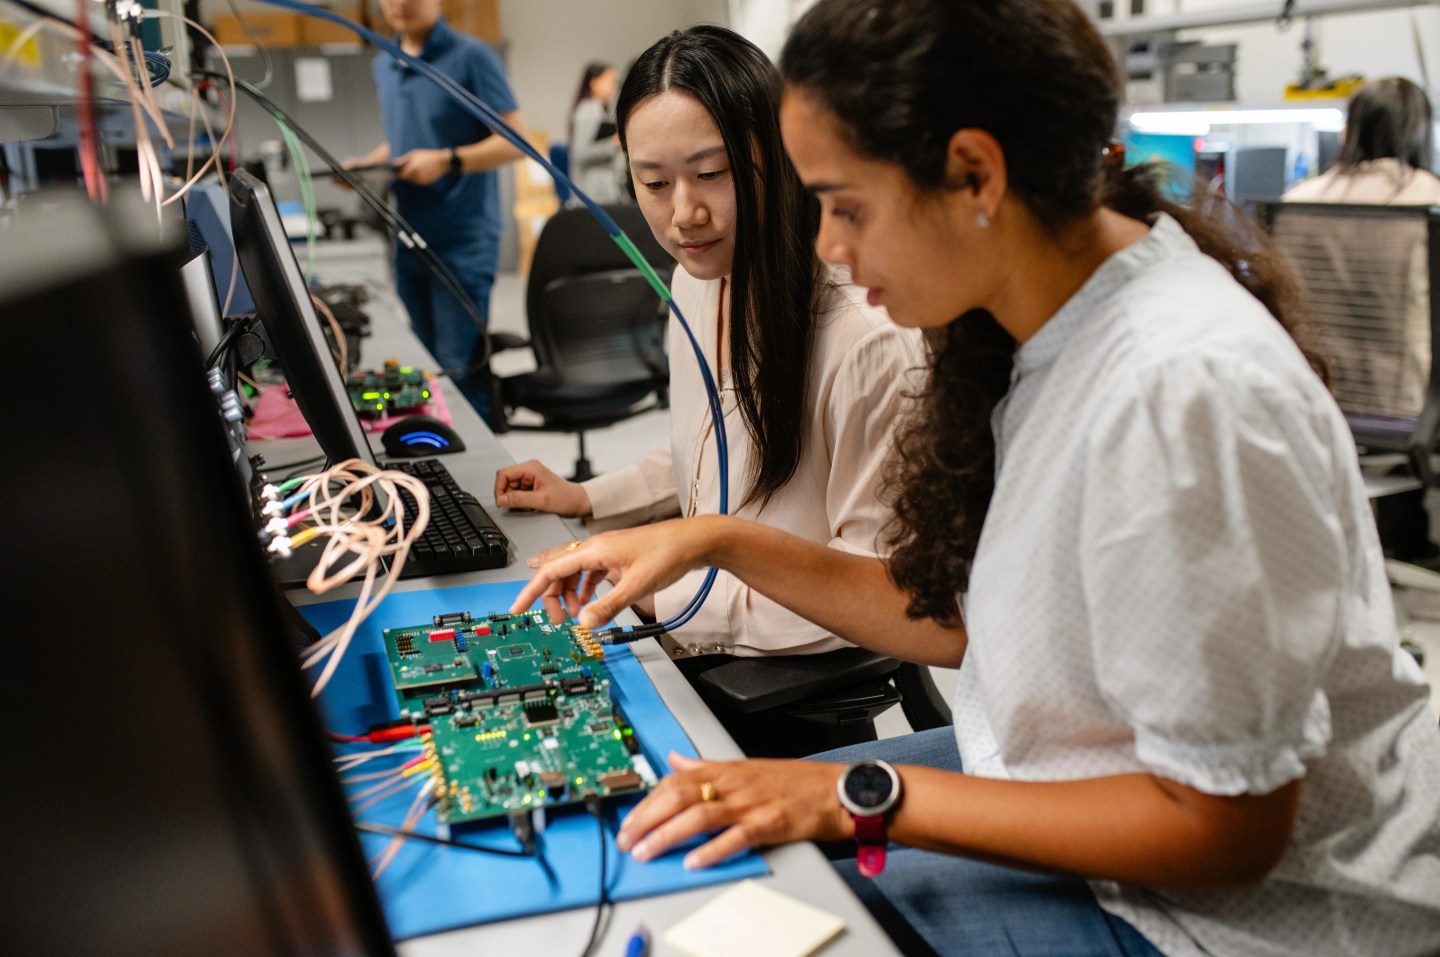
Courtesy of Marvell Technology, Inc
- Company Information
- Best Workplaces In The Bay Area
- Best Companies To Work For Southeast Asia
- Key Financials (last Fiscal Year)
- Profit Ratios
- Earnings Per Share (last Fiscal Year)
- Total Return
- Updated:6/3/26
- Country/Territory:U.S.
- Headquarters:Wilmington, Del.
- Industry:Semiconductors and Other Electronic Components
- CEO:Matthew J. Murphy
- Website:https://www.marvell.com
- Ticker:MRVL
- Company type:Public
- Revenues ($M):$8,195
- Profits ($M):$2,670
- Market value ($M):$86,599
- Number of employees:7,480
Figures are for fiscal year ended Jan. 31, 2026. Market value as of March 31, 2026.
- Founded:1995
- Web Address:https://www.marvell.com/
- U.S. Employees:3,248
- Worldwide Employees:7,486
- Sites:16
- City:Santa Clara, Calif.
- Industry:Electronics
- Date info provided (companies may opt to keep some data confidential):Feb. 2, 2023
- Sector:Technology
- Type of organization:Public
- CEO/Top executive:Matthew J. Murphy
- Group headquarters:U.S.
- HQ location:Wilmington, Del.
- GPTW national list:Vietnam
- Woman CEO:no
- $ millions% change
- Revenues ($M):$8,194.642.1%
- Profits ($M):$2,670.1-
- Assets ($M):$22,285.3-
- Total Stockholder Equity ($M):$14,308.4-
- Profit as % of Revenues:32.6%
- Profits as % of Assets:12%
- Profits as % of Stockholder Equity:18.7%
- Earnings Per Share ($):3.10
- EPS % Change (from prior fiscal year):-
- EPS % Change (5 year annual rate):-
- EPS % Change (10 year annual rate):-
- Total Return to Investors (last year):-22.8%
- Total Return to Investors (5 year, annualized):12.8%
- Total Return to Investors (10 year, annualized):26.5%
Marvell Technology stock chart
Marvell Technology in Fortune Rankings
- Fortune 500
- Best Workplaces in Engineering
- Fortune 100 Best Companies To Work For – Southeast Asia
- Best Large Workplaces in the Bay Area