CHS is an agricultural company owned by ranchers, farmers, and cooperatives throughout the U.S. The company processes and markets grain, seeds, seed oil, crop protection products, and animal feed. CHS also operates petroleum refineries and pipelines, as well as markets and distributes refined fuels, lubricants, and renewable energy products under the brand name Cenex.
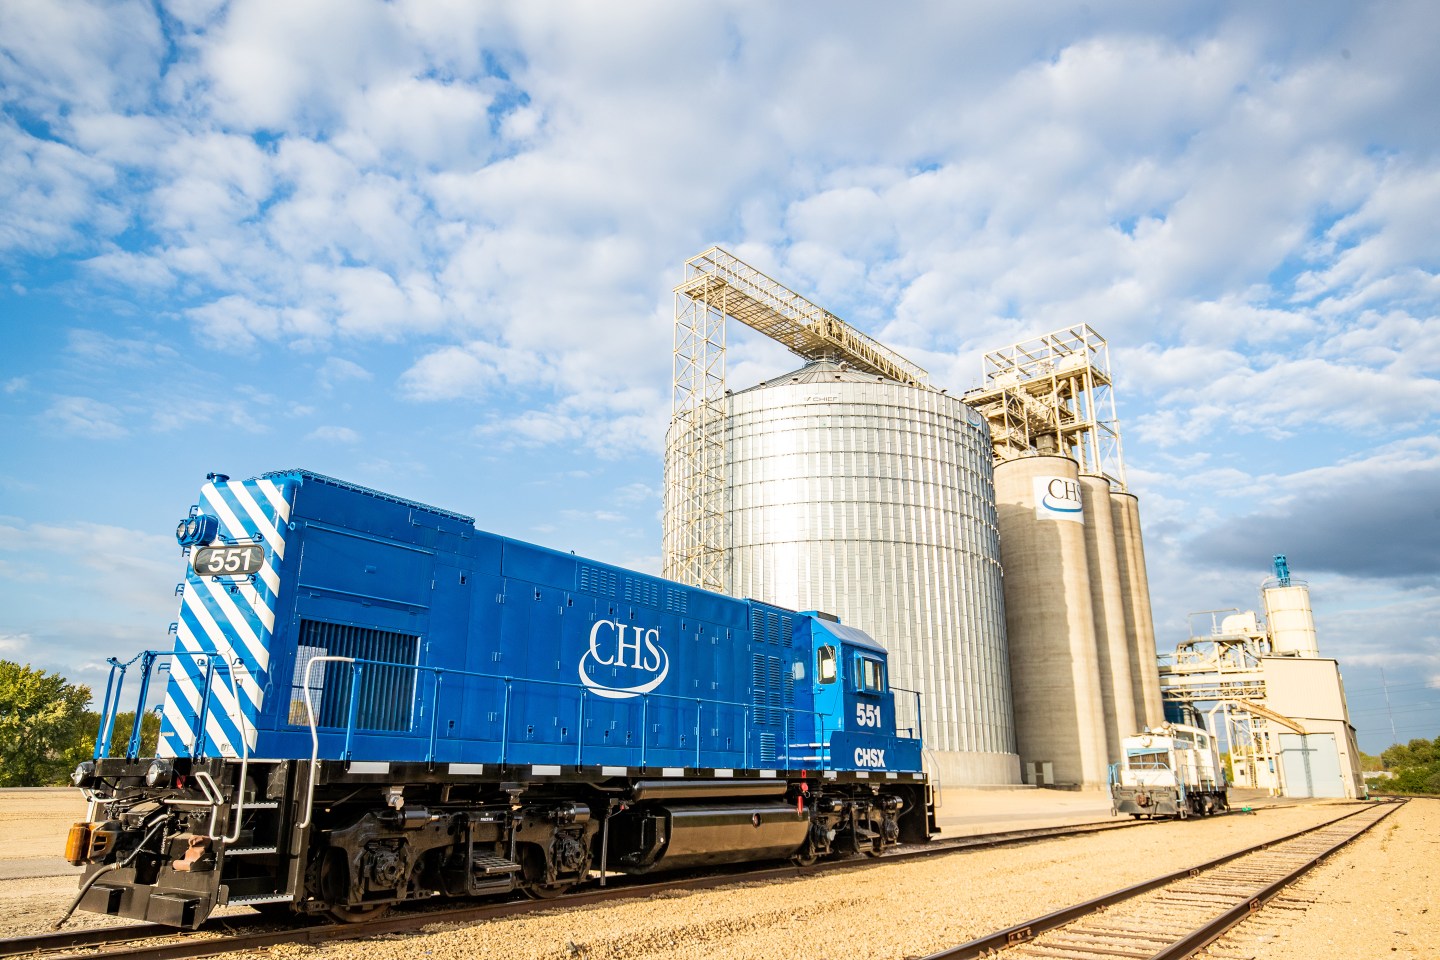
Courtesy of CHS