German diversified chemicals group BASF is headquartered in Ludwigshafen, Germany and supplies petrochemicals and precursors for plastics, catalysts and battery materials for automotive, pesticides and herbicides for agriculture, biopolymers and surfactants for cosmetics, as well as vitamins and emulsifiers for food manufacturers. The group is the world's largest chemicals business outside of China, known for its broad portfolio supporting clients across global industries.
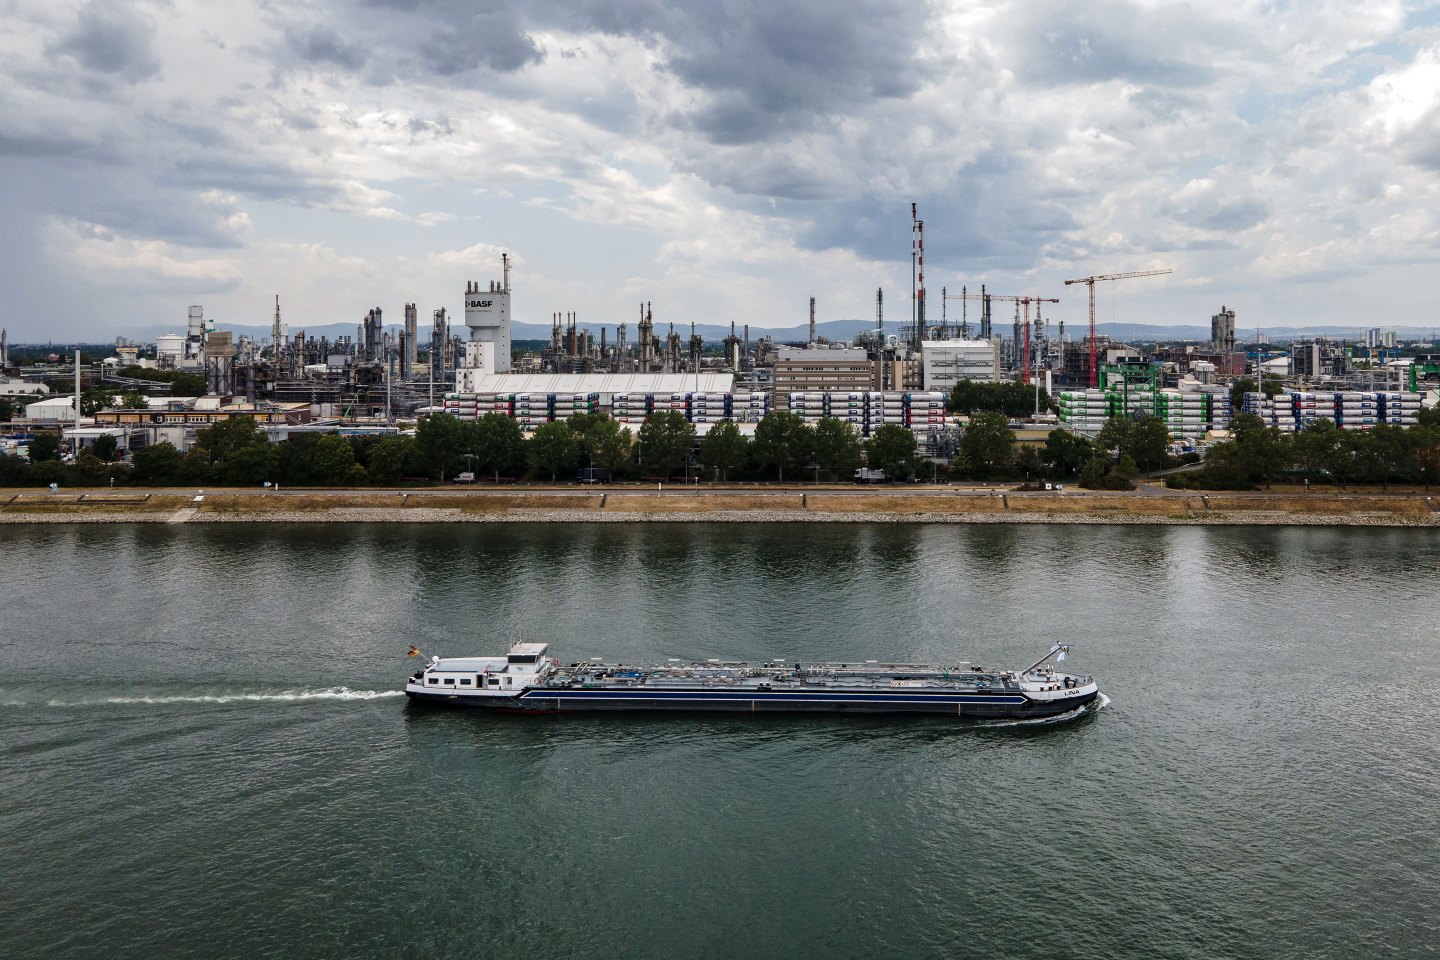
Ben KilbBloomberg via Getty Images