What’s the biggest sports event of the year?
That depends on how you’re defining “big.” Ranked strictly by television ratings, the NFL’s Super Bowl is tops: The most recent one, XLVIII, in which the Seattle Seahawks trounced the Denver Broncos, garnered some 111.5 million U.S. viewers; it was the most-watched television event ever. Measured by sustained social media interaction or global reach, the big event is likely the Olympic Games. (Sorry, World Cup fans.)
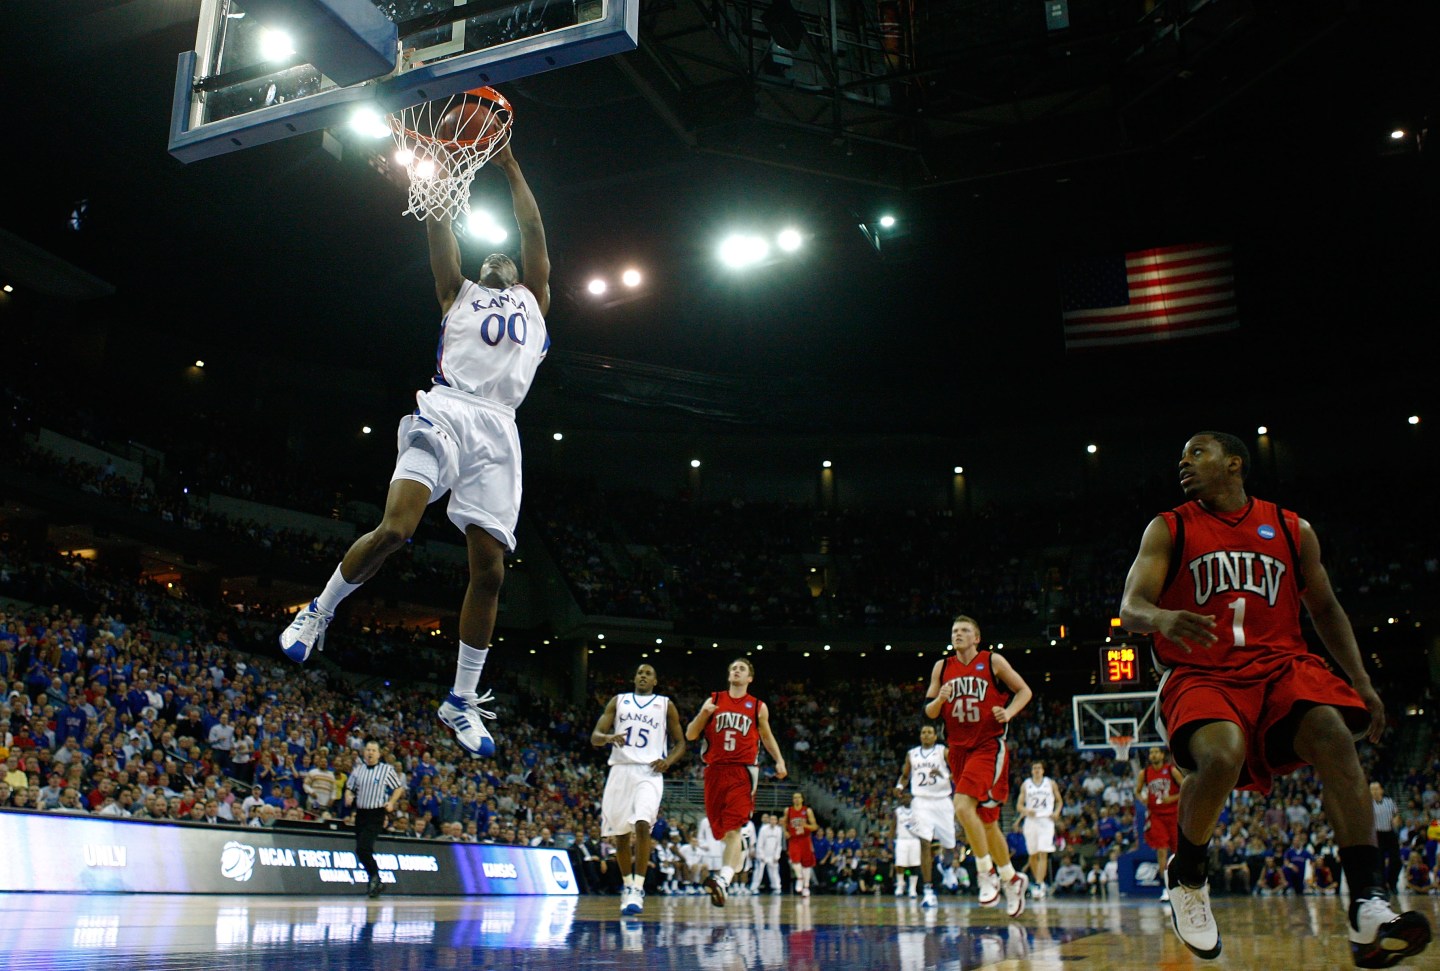
But it may surprise you to learn which event’s advertisements most compel viewers to spend their hard-earned money. According to Chicago-based Networked Insights, it’s March Madness, the month-long NCAA men’s basketball tournament. Immediately before, during, and after last year’s tournament — a three-week span — Networked Insights saw an overall 8% increase in intent-to-purchase, according to a study it shared exclusively with Fortune. That means March Madness viewers were 8% more likely to purchase products they had seen advertised on TV than they were before the games began.
This is, of course, the result that advertisers seek. According to Kantar Media, advertisers spend more on television ads during March Madness than in the postseason of any professional sports league: $1.15 billion on March Madness last year, compared to $1.10 billion on the NFL and $929 million on the NBA.
(Through this year’s Elite 8 quarter-final games, purchase intent for March Madness fans was up 3%, though that’s not as much of an increase as it was in 2013.)
Networked Insights arrives at these conclusions by sifting through what CEO Dan Neely, who worked at web agency Scient when it built MLB.com in the 1990s, calls “dark data,” the bits of less obviously relevant information in social posts that brands overlook when they conduct searches for mentions of their company.
“Dark data are the things that you wouldn’t know to look for,” Neely tells Fortune. “Most marketers still don’t understand that we now have unprecedented access to intelligence on the way that people interact with the things they like and watch.”
Neely’s company accesses this dark data by “tagging” posts across all social media platforms with thousands of narrow classifiers beyond what is contained overtly in the language of a post. So if the company’s platform analyzes a tweet that says, “BOOM! Good work Hauschka #hottie” the obvious information is that the person is watching a Seattle Seahawks game, likes the NFL, and has an affinity for Seattle placekicker Steven Hauschka — along with any other information gleaned from that person’s account, like whether the person is a Seattle-area resident and/or a woman. The company also analyzes other posts by the person to determine a possible age range, “type” of viewer, how often the person has engaged with that sport or team in the past, and — most importantly to the companies that use Networked Insights’ data — what other brands that fan likes.
This process has helped the company come to some surprising conclusions. For example, millennial-generation golfers and golf fans are more interested in Rickie Fowler than they are in Tiger Woods. Further, fans of NASCAR index higher for luxury clothing brands like Michael Kors and Louis Vuitton, despite a pervasive “redneck” stereotype. (For more, see: Inside NASCAR’s sponsor club.)
“Moneyball is 15 years old,” Neely points out. “And yet, while [various sports bodies] are putting the power of data to use, marketers and brands still are not all doing it. This stuff exists, it’s existed now for a while, and it’s time for people to get on the bandwagon to discover the thing they didn’t know to look for.”