President Joe Biden on Wednesday called on Americans to do their patriotic duty and get a COVID shot. He urged businesses (with the enticement of a tax credit) to give their employees the paid time-off to do so.
The President’s renewed appeals come as the country is fast-approaching an arguably more difficult stage of its vaccine roll-out—one where demand for the vaccine no longer outstrips supply.
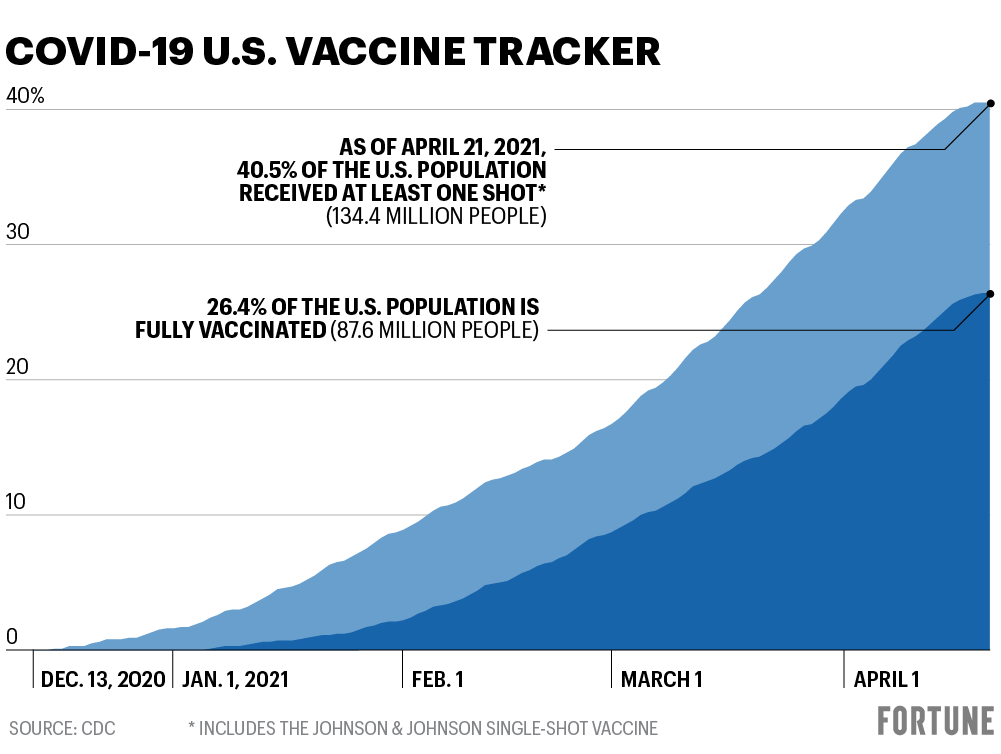
As of April 21, 133.4 million Americans—including 80.6% of seniors, 51.5% of adults, and 40.5% of the total population—had received at least one dose of a coronavirus vaccine, according to data from the Centers for Disease Control and Prevention. That’s up from 123.9 million people a week ago. Roughly 87.6 million Americans, or 26.4% of the population, have been fully vaccinated. In total, since the rollout began in December, the U.S. has administered 216 million vaccines of the 277.9 million distributed across the country.
All but about 8 million of those 216 million shots have been mRNA vaccine doses developed by Pfizer and Moderna. While regulators in the EU have stated that benefits outweigh the risks of using Johnson & Johnson’s single-dose COVID vaccine, which has been linked to extremely rare blood-clotting incidents, the vaccine’s use remains on pause in the U.S.
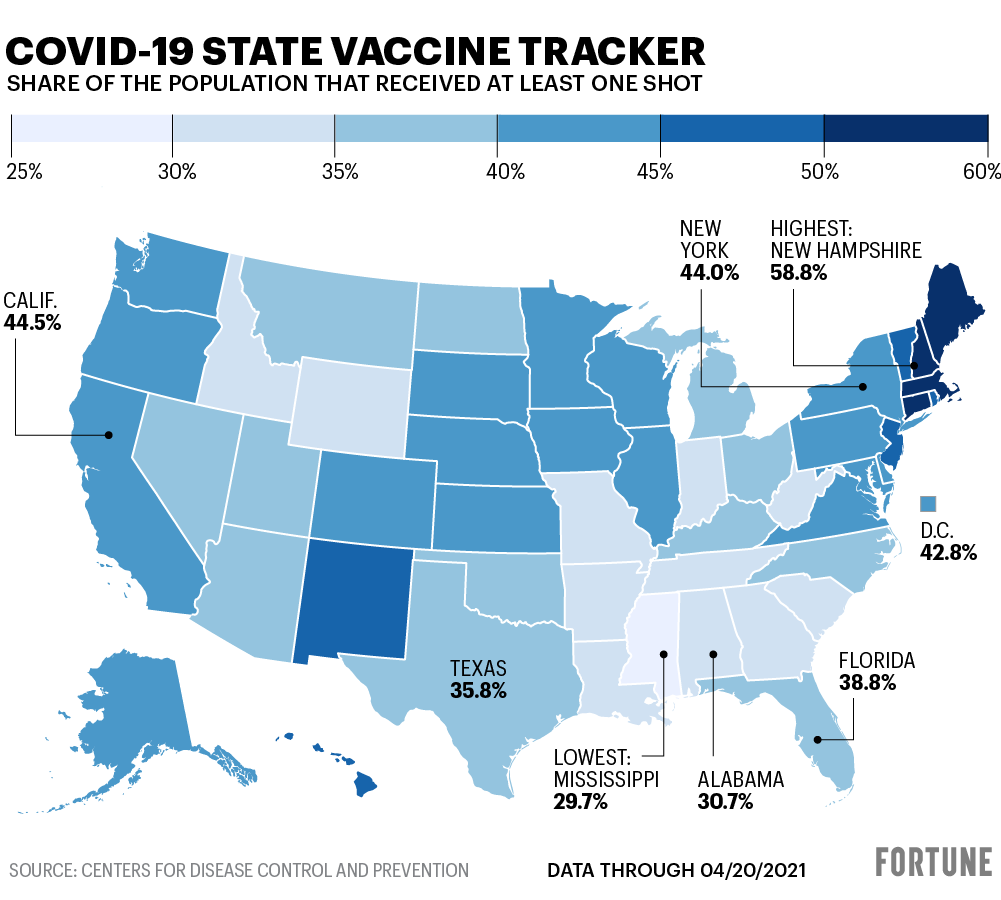
Across the nation, the share of vaccinated individuals varies widely by state. New Hampshire leads the country with 58.8% of its residents having received at least one dose of a vaccine. Several other states in the Northeast, including Connecticut, Massachusetts, and Maine have also vaccinated more than half of their populations. Mississippi has the lowest share of vaccinated residents and is the only state where the number is below 30%.
Share of the population that has received at least once shot
| State or territory | Share vaccinated |
| Alaska | 40.2% |
| Alabama | 30.7% |
| Arkansas | 33.9% |
| Arizona | 38.2% |
| California | 44.5% |
| Colorado | 43.3% |
| Connecticut | 50.3% |
| District of Columbia | 42.8% |
| Delaware | 42.9% |
| Florida | 38.8% |
| Georgia | 33.1% |
| Guam | 43.3% |
| Hawaii | 47.1% |
| Iowa | 41.5% |
| Idaho | 32.5% |
| Illinois | 42.7% |
| Indiana | 33.8% |
| Kansas | 40.7% |
| Kentucky | 39.2% |
| Louisiana | 31.2% |
| Massachusetts | 50.0% |
| Maryland | 44.1% |
| Maine | 50.0% |
| Michigan | 39.4% |
| Minnesota | 43.1% |
| Missouri | 34.9% |
| Mississippi | 29.7% |
| Montana | 38.8% |
| North Carolina | 37.0% |
| North Dakota | 38.1% |
| Nebraska | 41.4% |
| New Hampshire | 58.8% |
| New Jersey | 47.4% |
| New Mexico | 48.4% |
| Nevada | 37.1% |
| New York | 44.0% |
| Ohio | 38.3% |
| Oklahoma | 37.4% |
| Oregon | 40.0% |
| Pennsylvania | 44.7% |
| Puerto Rico | 32.3% |
| Rhode Island | 46.8% |
| South Carolina | 34.9% |
| South Dakota | 43.3% |
| Tennessee | 32.5% |
| Texas | 35.8% |
| Utah | 36.6% |
| Virginia | 43.2% |
| Virgin Islands | 30.6% |
| Vermont | 48.9% |
| Washington | 41.7% |
| Wisconsin | 43% |
| West Virginia | 34.8% |
| Wyoming | 32.8% |