America’s otherwise smooth coronavirus vaccine rollout took a dramatic turn this week, with the abrupt pause in the use of Johnson & Johnson’s COVID shot due to concerns about extremely rare blood clotting incidents. President Joe Biden said yesterday the development would not slow the nation’s vaccine drive. Even so, with the Centers for Disease Control and Prevention meeting with J&J today about the fate of that vaccine, and new cases of COVID on the rise due to the spread of more contagious variant strains, the ongoing distribution of Moderna and Pfizer’s two-shot vaccines takes on even greater urgency.
The good news is many people already have some protection against the virus. As of April 14, 123.9 million Americans have received at least one dose of a COVID vaccine, according to data from the CDC. That group, up from 110 million people last week, includes 79.6% of individuals over the age of 65, 47.6% of people over the age of 18, and 37.3% of the total population. Nearly 76.7 million Americans, or 23.1% of the population, have been fully vaccinated.
In total, the country has administered 194.8 million vaccines. The vast majority of those have been doses of the Pfizer and Moderna vaccines; J&J’s shot accounts for 7.5 million of administered doses.

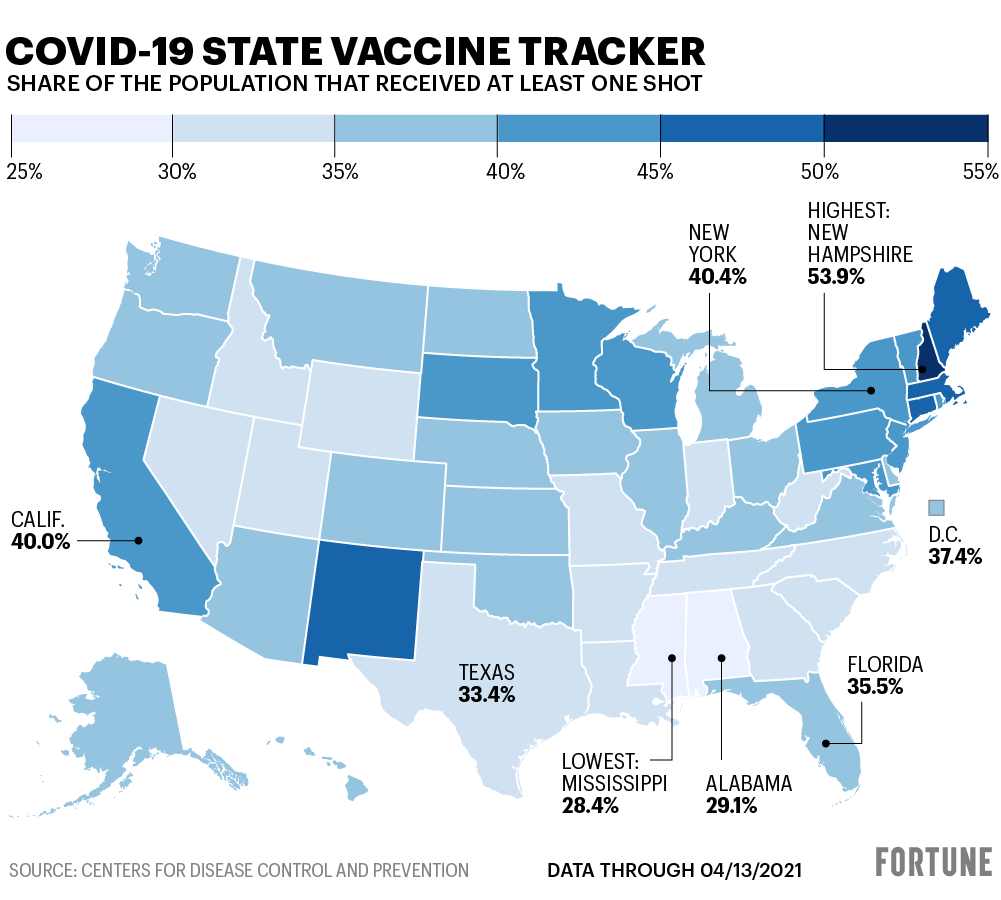
The share of people vaccinated in each state varies widely across the country, from 28.4% in Mississippi having received at least one dose to 53.9% in New Hampshire. California, the most populous state, has administered the most vaccines—23.7 million—and reached 40% of its population.
Reports from Europe, which has struggled with its rollout, in part due to similar concerns of extremely rare blood clotting incidents involving the AstraZeneca vaccine, suggest the EU may prioritize the purchase of mRNA vaccines going forward. Meanwhile, as Russia’s COVID vaccine, Sputnik, racks up approvals around the world, its limited use in Europe is a subject of some controversy.
Share of the population that has received at least once shot
| State or territory | Share vaccinated |
| Alaska | 38.8% |
| Alabama | 29.1% |
| Arkansas | 32.0% |
| Arizona | 35.8% |
| California | 40.0% |
| Colorado | 39.5% |
| Connecticut | 45.7% |
| District of Columbia | 37.4% |
| Delaware | 39.3% |
| Florida | 35.5% |
| Georgia | 31.0% |
| Guam | 40.3% |
| Hawaii | 37.7% |
| Iowa | 38.9% |
| Idaho | 30.9% |
| Illinois | 39.2% |
| Indiana | 31.3% |
| Kansas | 38.3% |
| Kentucky | 37.1% |
| Louisiana | 30.1% |
| Massachusetts | 45.3% |
| Maryland | 40.1% |
| Maine | 45.9% |
| Michigan | 36.1% |
| Minnesota | 40.0% |
| Missouri | 32.2% |
| Mississippi | 28.4% |
| Montana | 36.7% |
| North Carolina | 34.7% |
| North Dakota | 37.0% |
| Nebraska | 38.9% |
| New Hampshire | 53.9% |
| New Jersey | 43.5% |
| New Mexico | 45.4% |
| Nevada | 34.4% |
| New York | 40.4% |
| Ohio | 36.1% |
| Oklahoma | 35.8% |
| Oregon | 36.4% |
| Pennsylvania | 40.7% |
| Puerto Rico | 28.1% |
| Rhode Island | 42.1% |
| South Carolina | 33.1% |
| South Dakota | 41.6% |
| Tennessee | 30.6% |
| Texas | 33.4% |
| Utah | 33.7% |
| Virginia | 39.9% |
| Virgin Islands | 28.6% |
| Vermont | 43.9% |
| Washington | 38.1% |
| Wisconsin | 40.2% |
| West Virginia | 33.9% |
| Wyoming | 31.7% |