Our mission to make business better is fueled by readers like you. To enjoy unlimited access to our journalism, subscribe today.
In a week of declining coronavirus case numbers and unusually disruptive and widespread winter storms, America’s coronavirus vaccine rollout continued apace, with the nation administering an average of 1.76 million shots per day since last Wednesday, Feb. 10.
Through Tuesday, Feb. 16, 12.2% of the U.S. population, or 40.3 million people, had received at least one dose of a COVID vaccine, up from 33.8 million a week ago according to data from the Centers for Disease Control. And 15.5 million individuals, or 4.7% of the population, have been fully vaccinated with two doses of either the Pfizer or Moderna vaccines. In total, the country has administered 56.3 million doses, or 77.8% of the 72.4 million distributed.
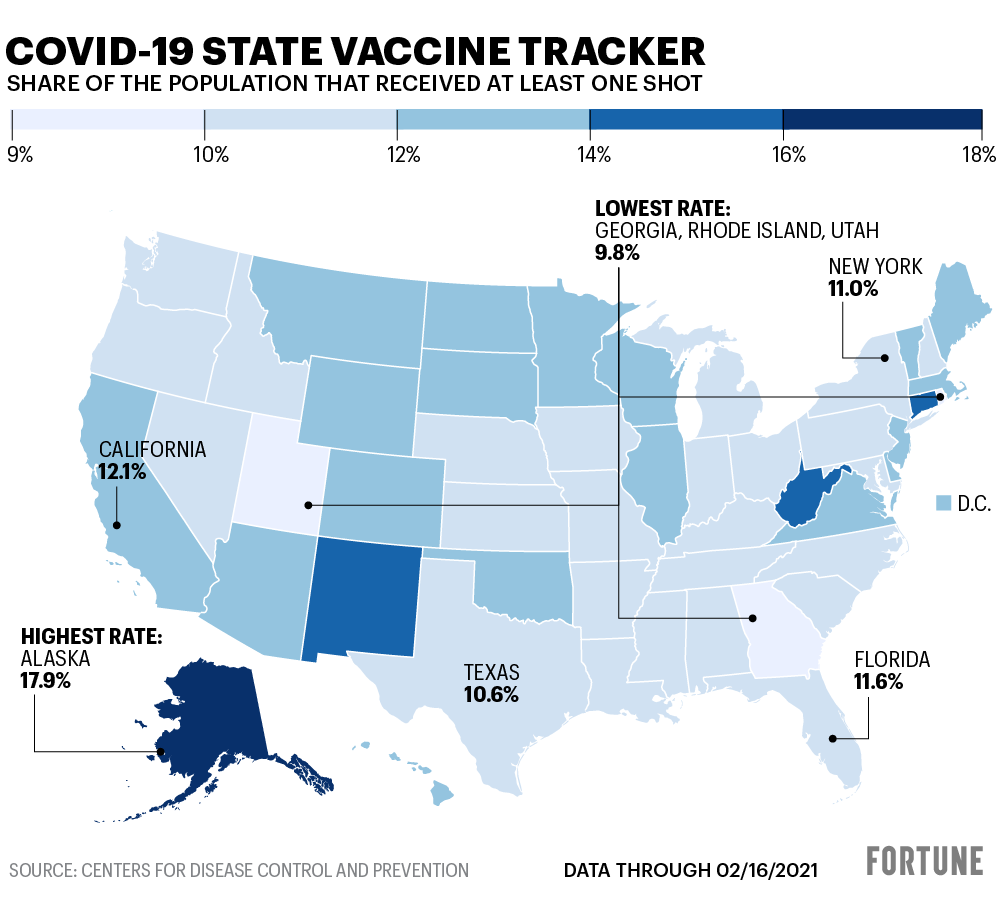
Alaska, which has received the greatest number of vaccines per capita, leads the nation in terms of the percent of residents reached with a COVID-19 vaccine, at 17.9%. All states have reached at least 10% of their populations—aside from Georgia, Rhode Island, and Utah, which have each vaccinated 9.8% of their populations with one dose.
As the most populous state, California has both received and administered the most doses of coronavirus vaccine—8.4 million and 6.3 million doses respectively. Texas, which has been contending with a crippling winter storm and mass power outages in recent days, has received the fewest doses per capita.

The U.S. rollout is likely to get a boost in coming weeks from the one-dose COVID vaccine developed by Johnson & Johnson. Though inventory is limited, the company has applied for emergency use authorization of its vaccine, which will be the subject of FDA discussions on Feb. 26.
Last night, President Joe Biden said at a CNN town hall that the nation should have supply to fully vaccinate 300 million Americans by the end of July.
SHARE OF THE POPULATION THAT RECEIVED AT LEAST ONE SHOT
| State or territory | Share vaccinated |
| Alaska | 17.9% |
| Alabama | 10.1% |
| Arkansas | 11.4% |
| Arizona | 12.3% |
| California | 12.1% |
| Colorado | 12.2% |
| Connecticut | 14.3% |
| District of Columbia | 12.5% |
| Delaware | 12.2% |
| Florida | 11.6% |
| Georgia | 9.8% |
| Hawaii | 12.1% |
| Iowa | 11.7% |
| Idaho | 10.7% |
| Illinois | 12.1% |
| Indiana | 11.9% |
| Kansas | 10.2% |
| Kentucky | 11.5% |
| Louisiana | 11.4% |
| Massachusetts | 12.8% |
| Maryland | 10.7% |
| Maine | 13.0% |
| Michigan | 11.4% |
| Minnesota | 12.1% |
| Missouri | 10.4% |
| Mississippi | 10.7% |
| Montana | 12.4% |
| North Carolina | 11.7% |
| North Dakota | 13.4% |
| Nebraska | 10.4% |
| New Hampshire | 11.2% |
| New Jersey | 12.0% |
| New Mexico | 14.4% |
| Nevada | 11.1% |
| New York | 11.0% |
| Ohio | 11.3% |
| Oklahoma | 12.3% |
| Oregon | 11.6% |
| Pennsylvania | 11.3% |
| Puerto Rico | 8.7% |
| Rhode Island | 9.8% |
| South Carolina | 10.7% |
| South Dakota | 12.8% |
| Tennessee | 10.0% |
| Texas | 10.6% |
| Utah | 9.8% |
| Virginia | 12.4% |
| Vermont | 12.6% |
| Washington | 11.8% |
| Wisconsin | 12.9% |
| West Virginia | 14.0% |
| Wyoming | 12.5% |