

I’m 43 years old, and like other members of my millennial generation, I’m not sure I’ll ever get Social Security benefits. It’s not top of mind for me right now, other than my role as a financial journalist, but the trust fund is due to run out in 2032, and the automatic 22% cut that follows won’t distinguish between who has been paying in and who has been drawing down.
But Social Security is perhaps the most vivid example of a pattern you see everywhere across the economy: Baby boomers hold the wealth, millennials carry the costs, Gen Z inherits the receipts. Several months ago, I used a metaphor first coined in 1974 by New York Times humorist Russell Baker to describe baby boomers’ impact on the economy around them: They are like a “pig in the python,” a bulge of 76 million being passed through America’s economic system, distorting everything along the way. A new analysis from the Committee for a Responsible Federal Budget, although it doesn’t use any generational framing, reinforces this fact.
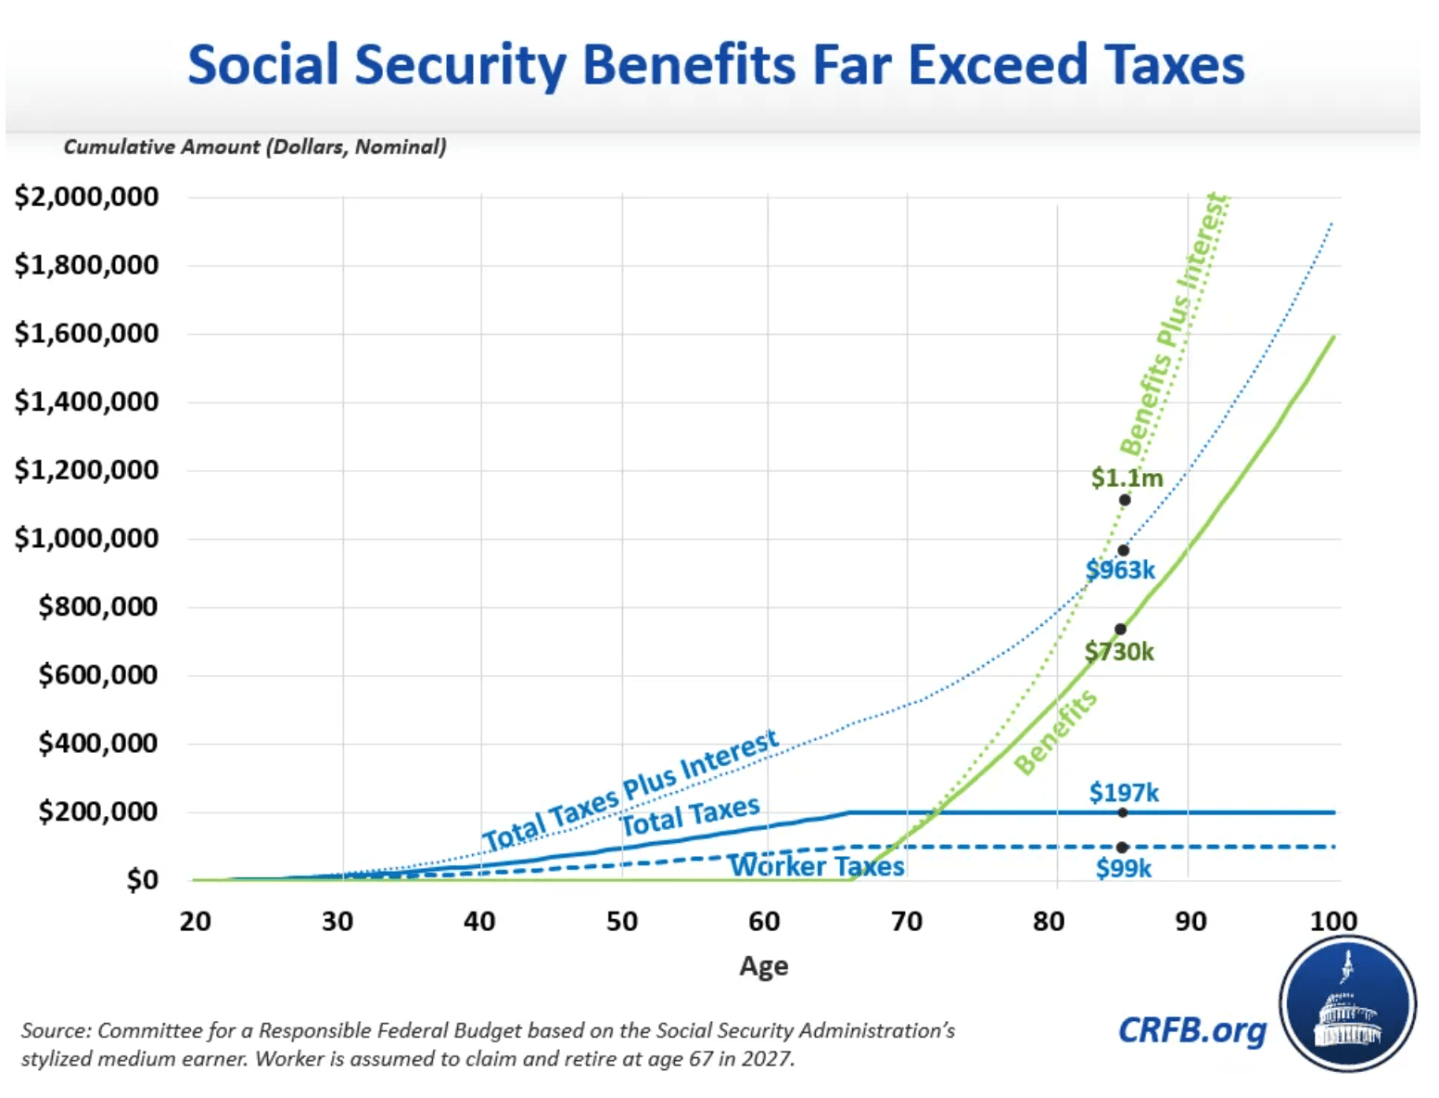
The nonpartisan budget watchdog, revisiting one of its favorite subjects, found that Americans retiring this decade are on track to collect, in the form of entitlements, about 133% of everything they and their employers paid in taxes, measured in present-value dollars. Strip out the employer match, and the return nearly doubles: Roughly 265% of what workers put in themselves. A median-wage retiree in 2027 will collect about $730,000 in lifetime benefits on combined contributions of less than $200,000. The math holds together because today’s payroll taxes are covering the gap. Who pays those taxes, and who is retiring and collecting? Largely millennials and baby boomers, respectively.
In nominal dollars, the gap is even more dramatic. A median-wage worker retiring in 2027 can expect about $730,000 in lifetime Social Security benefits, compared with less than $200,000 paid in taxes by that worker and their employer combined, according to CRFB. Benefits outpace total taxes paid after just six years of collecting. They outpace the worker’s own direct contributions after only three.
The pattern holds across the income spectrum. CRFB found every income quintile of this decade’s retirees is scheduled to receive at least as much as they paid in. The bottom quintile does best in relative terms, collecting about 266% of combined taxes paid—532% of their own share alone. Middle-income retirees average 147% of combined taxes, or nearly 294% of what they personally contributed. Even the wealthiest retirees, who come closest to a one-to-one match, still collect roughly double their own direct payments once you exclude the employer share.
None of that surplus is being paid for by some accumulated boomer nest egg. It’s paid for by payroll taxes taken from paychecks of the working-age population today—a population increasingly made up of millennials moving into their prime earning years, alongside Gen X.
“The reality is that Social Security is not a savings program where workers’ payroll tax contributions are saved in an account and used to pay their benefits,” the CRFB writes. “Nor are benefits based on or calculated to match a workers’ payroll tax contributions. Rather, Social Security is a pay-as-you-go social insurance program where current workers’ payroll taxes finance the benefits of current retirees.”
When there were 16 workers per retiree
The reason this arithmetic works at all—and the reason it’s now breaking down—comes down to a ratio that has been shrinking for eight decades. Social Security was built as a pay-as-you-go system, meaning it depends on there being enough workers paying in to cover the retirees drawing out. When the program was young, that ratio was overwhelming: more than 16 covered workers for every beneficiary in 1950. By 1960 it had fallen to about 5 to 1. Today it sits around 2.7 workers per beneficiary, and both the CBO and the Social Security Trustees project it will keep falling toward roughly 2 to 1 within a couple of decades.
That decline is the mechanical explanation for why benefits can run so far ahead of what any individual retiree paid in. Fewer workers are splitting the cost of supporting a larger, longer-living retired population. It’s also why the same benefit formula that pays out 33% more than it collects in taxes today is projected by the Social Security Trustees to cost 35% more than it collects in revenue over the next 75 years.
The consequence is a financing cliff that’s now closely dated. Social Security’s retirement trust fund is projected to be depleted in 2032, with the combined retirement and disability trust funds exhausted by around 2033 or 2034. After that point, according to the SSA Trustees Report, incoming payroll taxes alone would cover only about 78% of scheduled benefits—triggering an automatic, across-the-board cut of roughly 22% unless Congress intervenes before then.
The bulge that keeps reshaping the economy
Social Security’s math is the latest chapter in a broader story about how one outsized generation keeps reshaping the systems it moves through. The framing of the “pig in the python” is less about assigning blame to any one generation than describing a structural pattern: a large cohort passing through an economy built around smaller cohorts, bending the system to its scale at every life stage.
Baby boomers didn’t design Social Security’s pay-as-you-go structure, and they aren’t the first generation to collect more than they paid in: Every cohort of retirees since the 1940s has received a similarly favorable deal, back when the worker-to-beneficiary ratio was far more forgiving. Boomers also spent decades paying payroll taxes that built up the trust fund surplus now being drawn down to help cover the shortfall.
CRFB’s analysis isn’t an argument for slashing current retirees’ checks. The group is explicit that the goal isn’t to “indiscriminately cut current benefits to match past contributions,” but to stop treating the existing benefit formula as untouchable given that it’s scheduled to pay out far more than it takes in.
For this story, Fortune journalists used generative AI as a research tool. An editor verified the accuracy of the information before publishing.