• Home
  • News
  • Fortune 500
  • Tech
  • Finance
  • Leadership
  • Lifestyle
  • Rankings
  • Multimedia

Who Helped Trump Most in the 2016 Presidential Election? Nonvoters, Pew Study Says

By
Brittany Shoot
Brittany Shoot
Down Arrow Button Icon
By
Brittany Shoot
Brittany Shoot
Down Arrow Button Icon
August 9, 2018, 6:55 PM ET
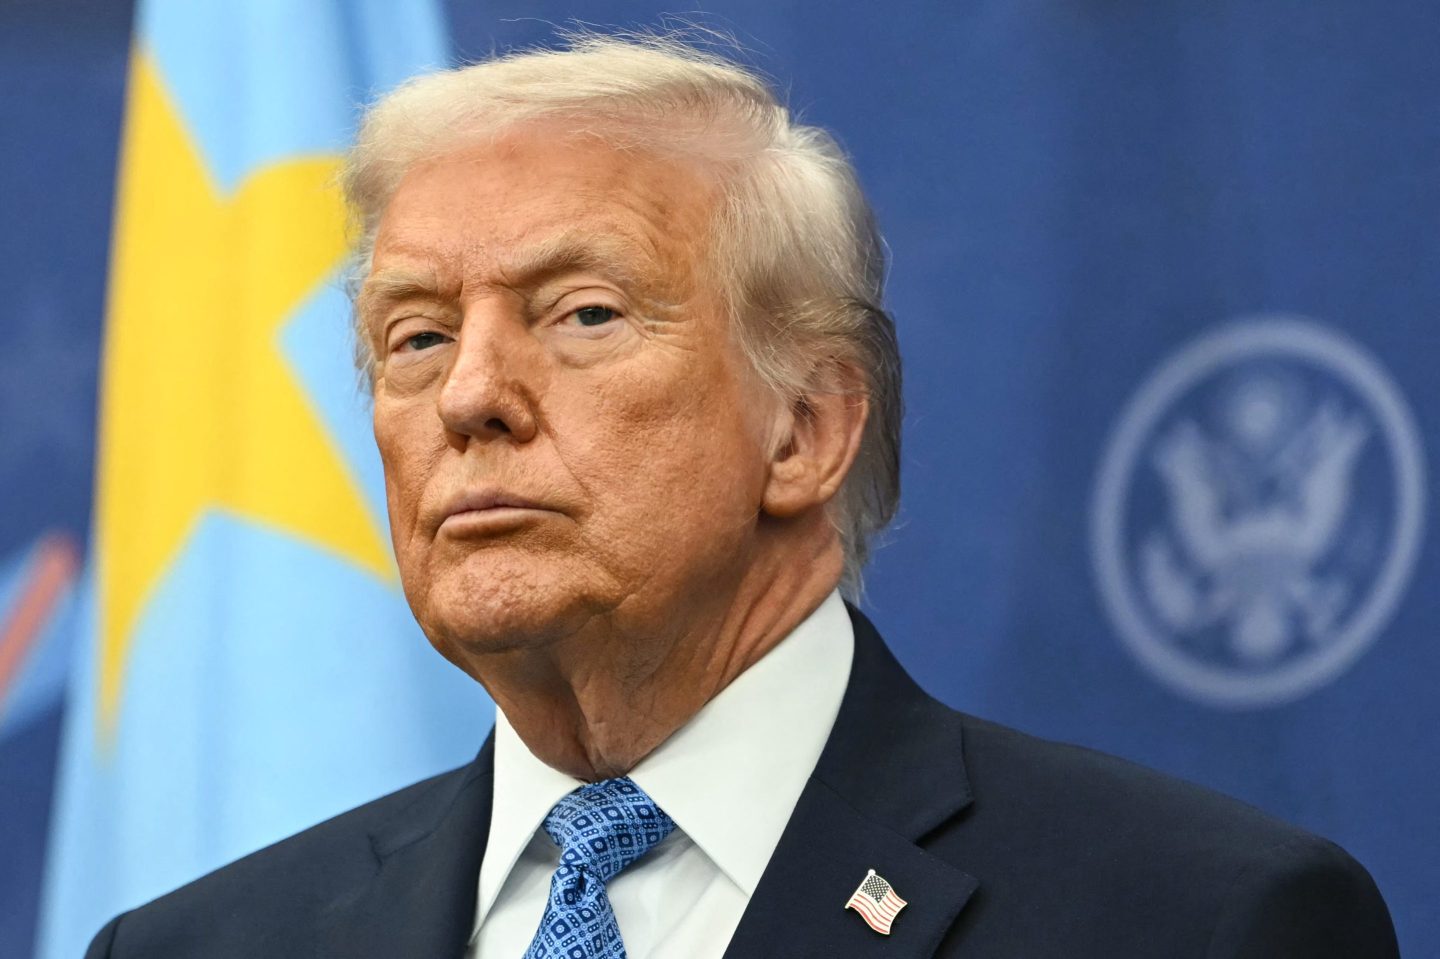
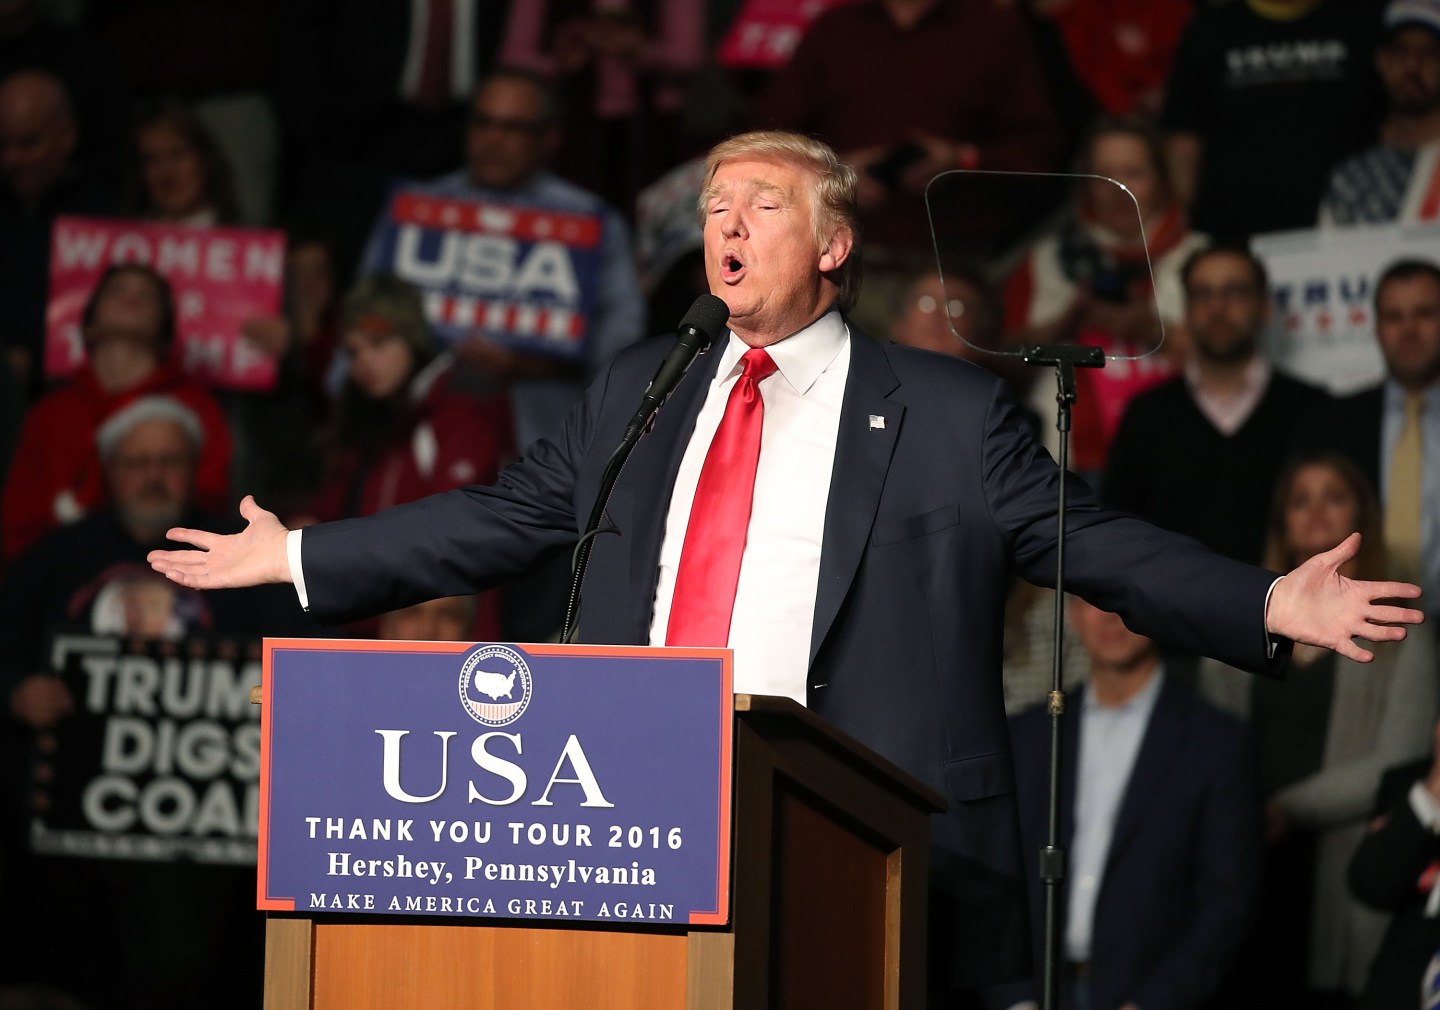
President Elect Donald Trump Holds Victory Rally In Pennsylvania
HERSHEY, PA - DECEMBER 15: US President-elect Donald Trump speaks to supporters during a rally at the Giant Center, December 15, 2016 in Hershey, Pennsylvania. President-elect Trump has been visiting several states that he won, to thank people for their support in the US election. (Photo by Mark Wilson/Getty Images)Mark Wilson—Getty Images

When it comes to the Donald Trump presidency, nonvoters are just as responsible as verified 2016 voters for the presidential election results, according to a new study from the Pew Research Center.

The study notes an important statistic: four in 10 Americans who were eligible to vote did not do so in 2016. And by taking the unique (and uniquely valuable) step of validating those who claimed they voted, Pew researchers were able to determine who actually voted and who did not. Breaking out these categories into hard data makes it clear: Nonvoters in 2016 had just as much to do with establishing the Trump presidency as actual voters.

The study researchers also expanded on the demographic and political distinctions between voters and voter-eligible nonvoters. They noted that compared with validated votes, “nonvoters were more likely to be younger, less educated, less affluent, and nonwhite.”

The study includes a lot of granular statistics, some of which easily stand alone. For example, “Democrats and Democratic-leaning independents made up a 55% majority of nonvoters,” the researchers noted. An increase in under-30 voters in key swing states could have cinched the election for popular vote winner Hillary Clinton.

As this chart shows, nonvoters were more likely than voters to be younger, less educated, less affluent and nonwhite. And nonvoters were much more Democratic. pic.twitter.com/6nsCpg2O8g

— Pew Research Center (@pewresearch) August 9, 2018

And while the study shows that nonvoters were less likely to align with the Republican Party, the data gets fuzzier in terms of how nonvoters feel ideologically. “Owing in part to the tendency of nonvoters to be politically disengaged more generally, there are far more nonvoters than voters who fall into the ‘mixed’ category on the ideological consistency scale,” the study authors noted.
About the Author
By Brittany Shoot
See full bioRight Arrow Button Icon
Rankings
  • 100 Best Companies
  • Fortune 500
  • Global 500
  • Fortune 500 Europe
  • Most Powerful Women
  • Future 50
  • World’s Most Admired Companies
  • See All Rankings
Sections
  • Finance
  • Leadership
  • Success
  • Tech
  • Asia
  • Europe
  • Environment
  • Fortune Crypto
  • Health
  • Retail
  • Lifestyle
  • Politics
  • Newsletters
  • Magazine
  • Features
  • Commentary
  • Mpw
  • CEO Initiative
  • Conferences
  • Personal Finance
  • Education
Customer Support
  • Frequently Asked Questions
  • Customer Service Portal
  • Privacy Policy
  • Terms Of Use
  • Single Issues For Purchase
  • International Print
Commercial Services
  • Advertising
  • Fortune Brand Studio
  • Fortune Analytics
  • Fortune Conferences
  • Business Development
About Us
  • About Us
  • Editorial Calendar
  • Press Center
  • Work At Fortune
  • Diversity And Inclusion
  • Terms And Conditions
  • Site Map

© 2025 Fortune Media IP Limited. All Rights Reserved. Use of this site constitutes acceptance of our Terms of Use and Privacy Policy | CA Notice at Collection and Privacy Notice | Do Not Sell/Share My Personal Information
FORTUNE is a trademark of Fortune Media IP Limited, registered in the U.S. and other countries. FORTUNE may receive compensation for some links to products and services on this website. Offers may be subject to change without notice.