
Nearly twice as many engineers as nurses died of fatal injuries while working in 2014, a new federal report found. The culprits in the 21 engineer and 12 nurse deaths included falls, car accidents, and exposure to deadly chemicals.
But those fatalities didn’t place either occupation on the list of the most dangerous jobs in America, because the fatalities were relatively rare compared to the total number of workers: Engineers, for example, lost 1.2 lives for every 100,000 workers.
Compare that to 111 deaths for every 100,000 loggers, who had the most dangerous civilian job in the U.S. in 2014, according to the Bureau of Labor Statistics’ recently updated Census of Fatal Occupation Injuries. Common dangers include falling branches and rough terrain.
Temp Jobs are Making Workplaces More Dangerous
That’s no surprise to Janet Webb, chief forester and president of Big Creek Lumber in central California, who said lumber workers face the additional challenge of being based in rural areas with limited access to hospitals.
“Whether it’s logging, fishing, or agriculture jobs, when you’re working in wilderness type settings you’re not right there next to [a] facility that can bail you out,” Webb said.
Explore the 25 most dangerous jobs in the table below.
| 2014 RANK | OCCUPATION | FATAL INJURIES PER 100,000 PEOPLE | TOTAL DEATHS |
|---|---|---|---|
| 1 | Logging workers | 110.9 | 78 |
| 2 | Fishers and related fishing workers | 80.8 | 22 |
| 3 | Aircraft pilots and flight engineers | 64 | 82 |
| 4 | Roofers | 47.4 | 83 |
| 5 | Refuse and recyclable material collectors | 35.8 | 27 |
| 6 | Farmers, ranchers, and other agricultural managers | 26.7 | 270 |
| 7 | Structural iron and steel workers | 25.2 | 15 |
| 8 | Driver/sales workers and truck drivers | 24.7 | 880 |
| 9 | Electrical power-line installers and repairers | 19.2 | 25 |
| 10 | Taxi drivers and chauffeurs | 18 | 68 |
| 11 | First-line supervisors of construction trades and extraction workers | 17.9 | 130 |
| 12 | Construction laborers | 16.9 | 208 |
| 13 | First-line supervisors of landscaping, lawn service, and groundskeeping workers | 16.4 | 33 |
| 14 | Maintenance and repairs workers, general | 14.4 | 68 |
| 15 | Police and sheriff’s patrol officers | 13.5 | 97 |
| 16 | Grounds maintenance workers | 13.1 | 158 |
| 17 | First-line supervisors of mechanics, installers, and repairers | 12.3 | 38 |
| 18 | Painters, construction and maintenance | 10.8 | 46 |
| 19 | Electricians | 10.4 | 79 |
| 20 | Telecommunications line installers and repairers | 10 | 19 |
The list corroborates Webb’s observation—after loggers, the second deadliest job belongs to fishers and other fishing workers, with 80 fatal injuries per 100,000 workers in 2014. That’s far higher than the average for all civilians of 3.4 fatal injuries per 100,000 workers; that average is up slightly from 3.3 in 2013.
The five most dangerous occupations remained unchanged from their 2013 ranking, while jobs involving construction, driving and repairs shifted slightly. Police officers became the 15th most dangerous job, up from 17th in 2013. But 2014’s 97 police deaths still remains below the 130 fatalities seen in 2011.
If You Die at Work, What Happens to Your Employer?
While the table ranks occupations by fatality rates, the total number of deaths for loggers is dwarfed by the number of fatalities for larger occupations, like truck drivers and farmers, which saw 880 and 270 deaths respectively.
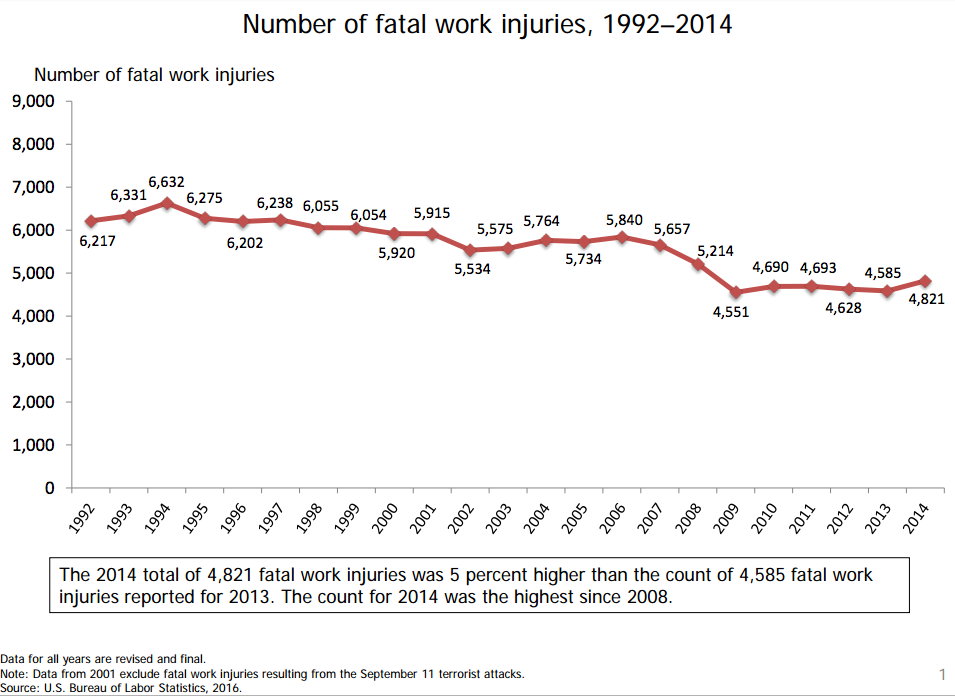
In all, there were a total of 4,821 fatal work injuries in the U.S. in 2014, slightly higher than the preliminary figure of 4,679 reported last September. The Bureau of Labor Statistics will publish the 2015 census of fatal work injuries in December 2016.
Methodology
Fatal injury rates exclude workers under the age of 16 years, volunteers, and resident military. Read more about the fatal work injury rate methodology here.
This article was originally published on Time.com


