
• Home
  • Latest
  • Fortune 500
  • Finance
  • Tech
  • Leadership
  • Lifestyle
  • Rankings
  • Multimedia

Trendingnow

1

'Skills nobody can take': Meet a 20-year-old with a 4.5 GPA who skipped college for technical school to land an 'AI-proof' career

2

Philanthropy leader at Warren Buffett and Bill Gates’ Giving Pledge says children of billionaires are pushing them to give their wealth away faster

3

China suffers another setback in effort to de-dollarize global finance as anchor in the greenback's dominance quietly exits Beijing's payment scheme

1

'Skills nobody can take': Meet a 20-year-old with a 4.5 GPA who skipped college for technical school to land an 'AI-proof' career

2

Philanthropy leader at Warren Buffett and Bill Gates’ Giving Pledge says children of billionaires are pushing them to give their wealth away faster

3

China suffers another setback in effort to de-dollarize global finance as anchor in the greenback's dominance quietly exits Beijing's payment scheme
InvestingFinance

In midterm years, October is usually the best month for stocks, with gains 73.7% of the time

Sheryl Estrada
By
Sheryl Estrada
Sheryl Estrada
Senior writer and author of CFO Daily
Down Arrow Button Icon
Sheryl Estrada
By
Sheryl Estrada
Sheryl Estrada
Senior writer and author of CFO Daily
Down Arrow Button Icon
September 23, 2026, 3:00 AM ET
Since 1950, September has been the weakest month of a midterm year, and October and November the strongest. Strategists say the setup, so far, still holds.
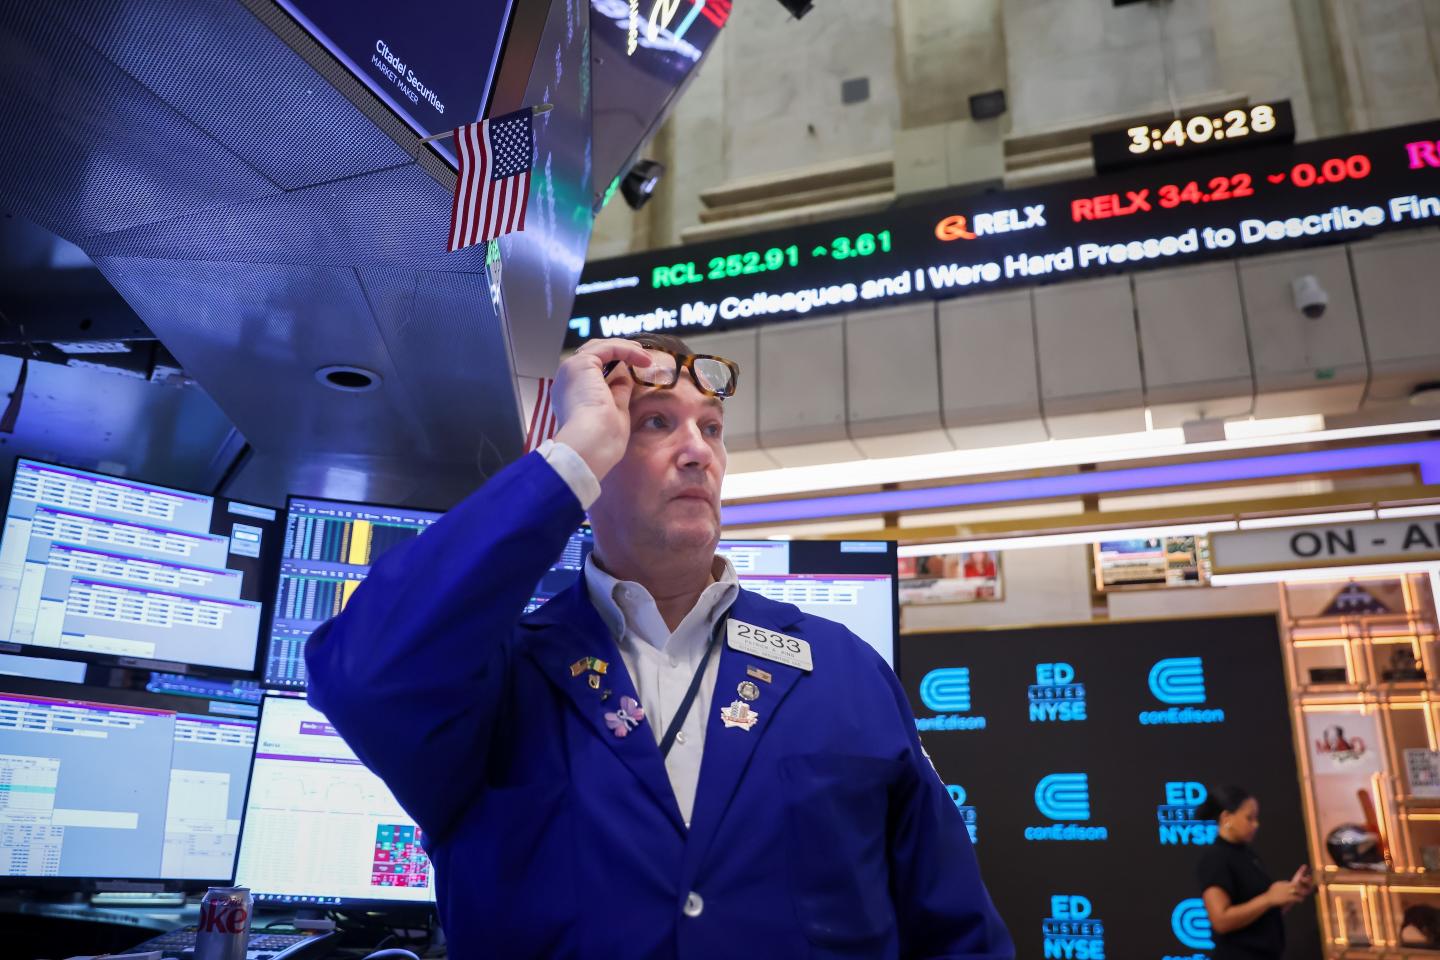
Since 1950, September has been the weakest month of a midterm year, and October and November the strongest. Strategists say the setup, so far, still holds.Getty Images
Google source logo
Add Fortune on Google for similar content.

If you’re a believer in stock market patterns, good news: History shows that in midterm election years, October is the best month of the year for stock performance, followed closely by November.

Recommended Video

Carson Group chief market strategist Ryan Detrick points to the seasonal pattern. In a chart posted on X on Sept. 20, Detrick showed that, since 1950, October has been the best-performing month of the year in U.S. midterm years, averaging a 3% gain for the S&P 500 and posting positive returns 73.7% of the time.

November ranks second, averaging a 2.7% gain, with positive returns 78.9% of the time. “Almost there,” he wrote, a nod to the fact that markets are just exiting what his data shows is the weakest month of the cycle: September, which has averaged a 0.8% decline.

The pattern also lines up with research from some of Wall Street’s biggest firms.

What UBS’s research shows

A recent report from UBS Global Research examined previous midterm elections since 1950, which is 19 in total, to assess their potential impact on equities and equity volatility. During midterm election years, S&P 500 returns have averaged about 6% from September through year-end, compared with about 4% in other years. Through March, the average return has been approximately 14%, according to the report.

Returns were negative only in 1978, amid inflation; 2002, during the bursting of the tech bubble; and 2018, amid the trade war and the Federal Reserve’s rate hikes.

“The market has typically been choppy from August-end until early October, with a median decline of -1.4%, before the market starts to rally through year-end and into the next year,” UBS strategist Maxwell Grinacoff wrote in a research note. The rally in U.S. equities around midterm elections has historically outpaced the market’s average performance in other years, according to Grinacoff.

Equity volatility follows a similar pattern. September and October have historically been the most volatile months on record since 1928, particularly during midterm election years. Volatility, however, has ultimately normalized after the elections and into year-end, he explained.

The Q4 pattern, according to JPMorgan

J.P. Morgan Asset Management finds that the S&P 500 has historically been slightly negative on average in each of the first three quarters of midterm years, before averaging a 6.6% gain in the fourth quarter. It also notes that markets have historically begun rallying less than a month before Election Day.

This year’s setup adds tension to that historical pattern. The S&P 500 was up approximately 13% year to date on a total return basis as of September 18, putting 2026 on track for a fourth consecutive year of gains.

That raises the question: Does a historically strong Q4 still play out after the market has already banked such strong gains, or does the market’s valuation and economic backdrop alter the historical pattern?

J.P. Morgan’s analysis suggests that the historical Q4 pattern should not be viewed in isolation. The firm says markets tend to rally as Election Day approaches because election related uncertainty is reduced, while emphasizing that fundamentals, including monetary policy, economic growth, labor markets, corporate profits and valuations, are more important indicators of future returns than the election calendar itself.

Fortune Daily breaks the traditional barrier between audience and newsroom. The show transforms Fortune’s trusted reporting into actionable, conversational, and entertaining insights for an emerging class of business leaders. Watch here.
About the Author
Sheryl Estrada
By Sheryl EstradaSenior writer and author of CFO Daily
LinkedIn iconTwitter icon

Sheryl Estrada is a senior writer at Fortune, where she covers the corporate finance industry, Wall Street, and corporate leadership. She also authors CFO Daily.

See full bioRight Arrow Button Icon
Google source logo
Add Fortune on Google for similar content.

Latest in Investing


Most Popular

Fortune Secondary Logo
Rankings
  • 100 Best Companies
  • Fortune 500
  • Global 500
  • Fortune 500 Europe
  • Most Powerful Women
  • World's Most Admired Companies
  • See All Rankings
  • Lists Calendar
Sections
  • Finance
  • Fortune Crypto
  • Features
  • Leadership
  • Health
  • Commentary
  • Success
  • Retail
  • Mpw
  • Tech
  • Lifestyle
  • CEO Initiative
  • Asia
  • Politics
  • Conferences
  • Europe
  • Newsletters
  • Personal Finance
  • Environment
  • Magazine
  • Education
Customer Support
  • Frequently Asked Questions
  • Customer Service Portal
  • Privacy Policy
  • Terms Of Use
  • Single Issues For Purchase
  • International Print
Commercial Services
  • Advertising
  • Fortune Brand Studio
  • Fortune Analytics
  • Fortune Conferences
  • Business Development
  • Group Subscriptions
About Us
  • About Us
  • Press Center
  • Work At Fortune
  • Terms And Conditions
  • Site Map
  • About Us
  • Press Center
  • Work At Fortune
  • Terms And Conditions
  • Site Map
  • Facebook icon
  • Twitter icon
  • LinkedIn icon
  • Instagram icon
  • TikTok icon
  • YouTube icon

    Latest in Investing


    Most Popular

    © 2026 Fortune Media IP Limited. All Rights Reserved. Use of this site constitutes acceptance of our Terms of Use and Privacy Policy | CA Notice at Collection and Privacy Notice | Do Not Sell/Share My Personal Information
    FORTUNE is a trademark of Fortune Media IP Limited, registered in the U.S. and other countries. FORTUNE may receive compensation for some links to products and services on this website. Offers may be subject to change without notice.