

The United States’ national debt crossed $40 trillion last month. Five months earlier, in March, the more consequential figure—debt held by the public as a share of Gross Domestic Product—had already hit 100% for the first time since just after World War II.
That threshold arrived at the tail end of an extraordinary run: every president who has occupied the Oval Office since 2001, save Joe Biden, was born a baby boomer, and boomers held a majority of Senate seats as recently as the 118th Congress. The Committee for a Responsible Federal Budget, the nonpartisan think tank that serves as a fierce budget hawk, issued a blog post retroactively looking at how we got here over the past quarter-century. What’s left unsaid is who was in power over that period, and the answer is overwhelmingly: boomers.
A quarter-century, mapped to a generation
In 2001, debt held by the public stood at 32% of GDP and was falling; and the federal government was running annual surpluses of 1% to 2% of GDP. Today, that debt has more than tripled to 100% of GDP, with deficits running around 6% annually.
The CRFB analysis, an update of its own 2024 report “From Riches to Rags”, that 25-year deterioration traces to three roughly equal forces: major tax cuts (37% of GDP), spending increases (33%), and recession responses like the 2008 financial crisis and COVID-19 relief (28%). Strip out any one of the three, CRFB found, and debt would sit close to where it stood in 2001. Strip out all three, and the national debt would be paid off today.
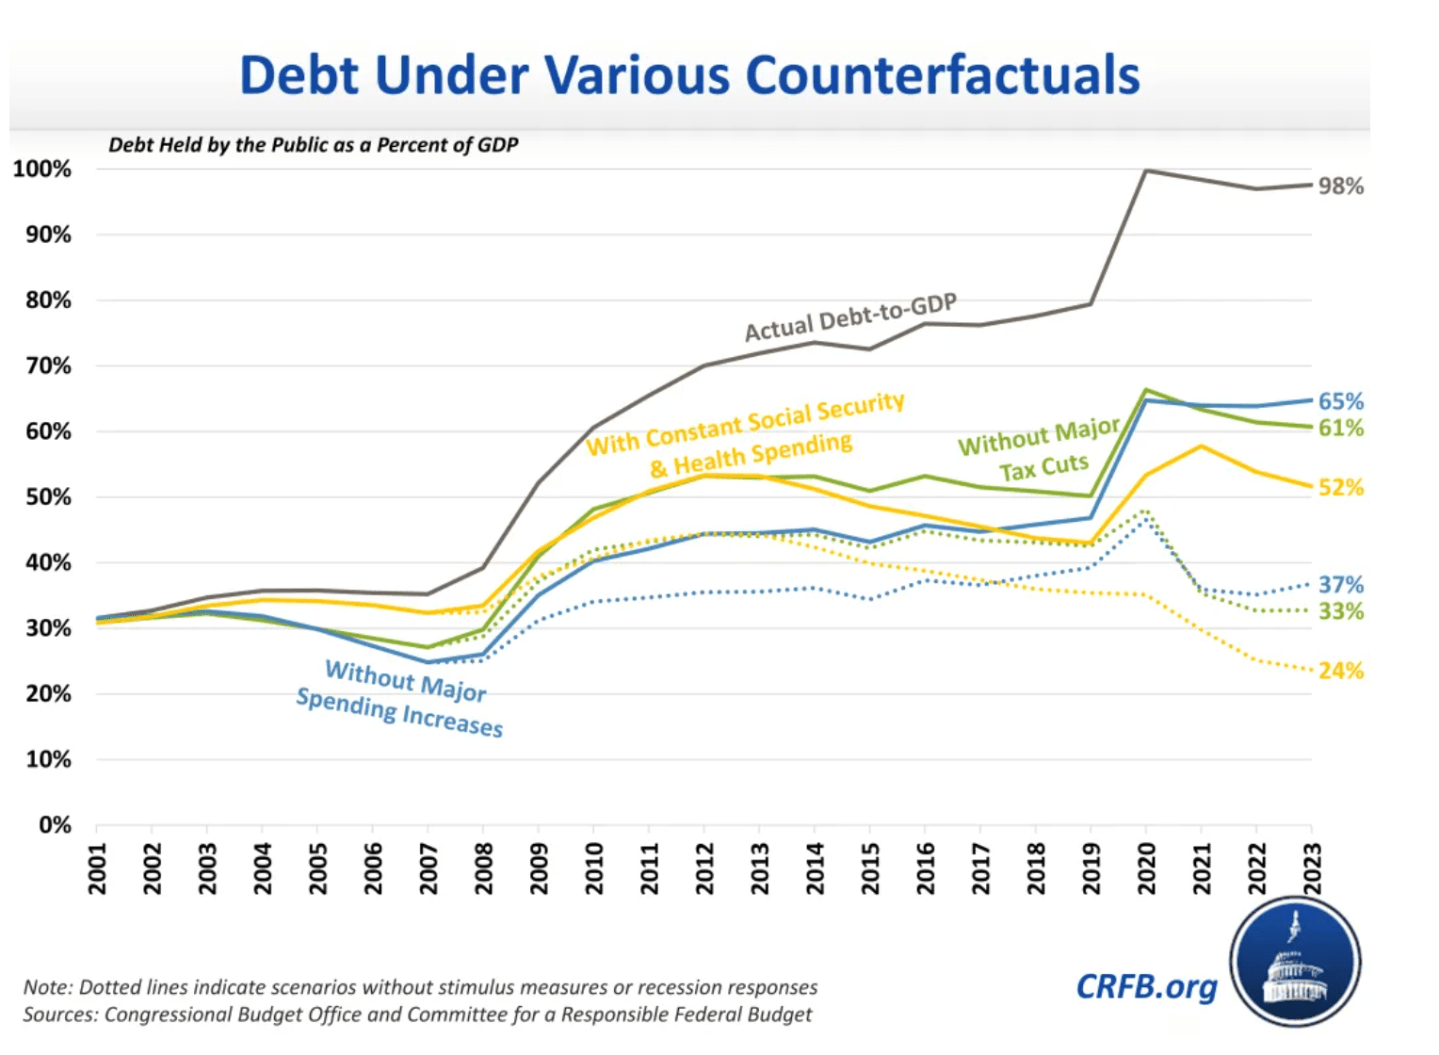
Every one of the major laws behind that math was signed by a boomer president. George W. Bush (born 1946) signed the 2001 and 2003 tax cuts and created Medicare Part D. Barack Obama (born 1961) extended the Bush tax cuts in 2010 and 2013. Donald Trump (born 1946) signed the 2017 Tax Cuts and Jobs Act and, in 2025, the One Big Beautiful Bill Act, which the Congressional Budget Office projects will add $4.7 trillion to the debt through 2035—and even more if its temporary provisions are made permanent, per earlier CRFB estimates. Biden, technically of the Silent Generation but politically continuous with the boomer era, presided over COVID-19 relief spending that, along with the 2007-2009 financial crisis response, added more than $6 trillion to the debt.
The Spending Skews Old
Beyond the legislative signatures, the money itself flows disproportionately toward the old. The Penn Wharton Budget Model calculates that the federal government spends roughly 10x more per capita on Americans over 65 than on those under 26; in aggregate, retirees receive 38.6% of all federal outlays—61.9% of spending that can be assigned to a specific age group—versus 10.3% for the youngest adults. The Manhattan Institute puts a sharper point on the same imbalance: in 2022, Americans 65 and older made up 17% of the population but received 66% of entitlement spending, while contributing just 11% of direct tax revenue.
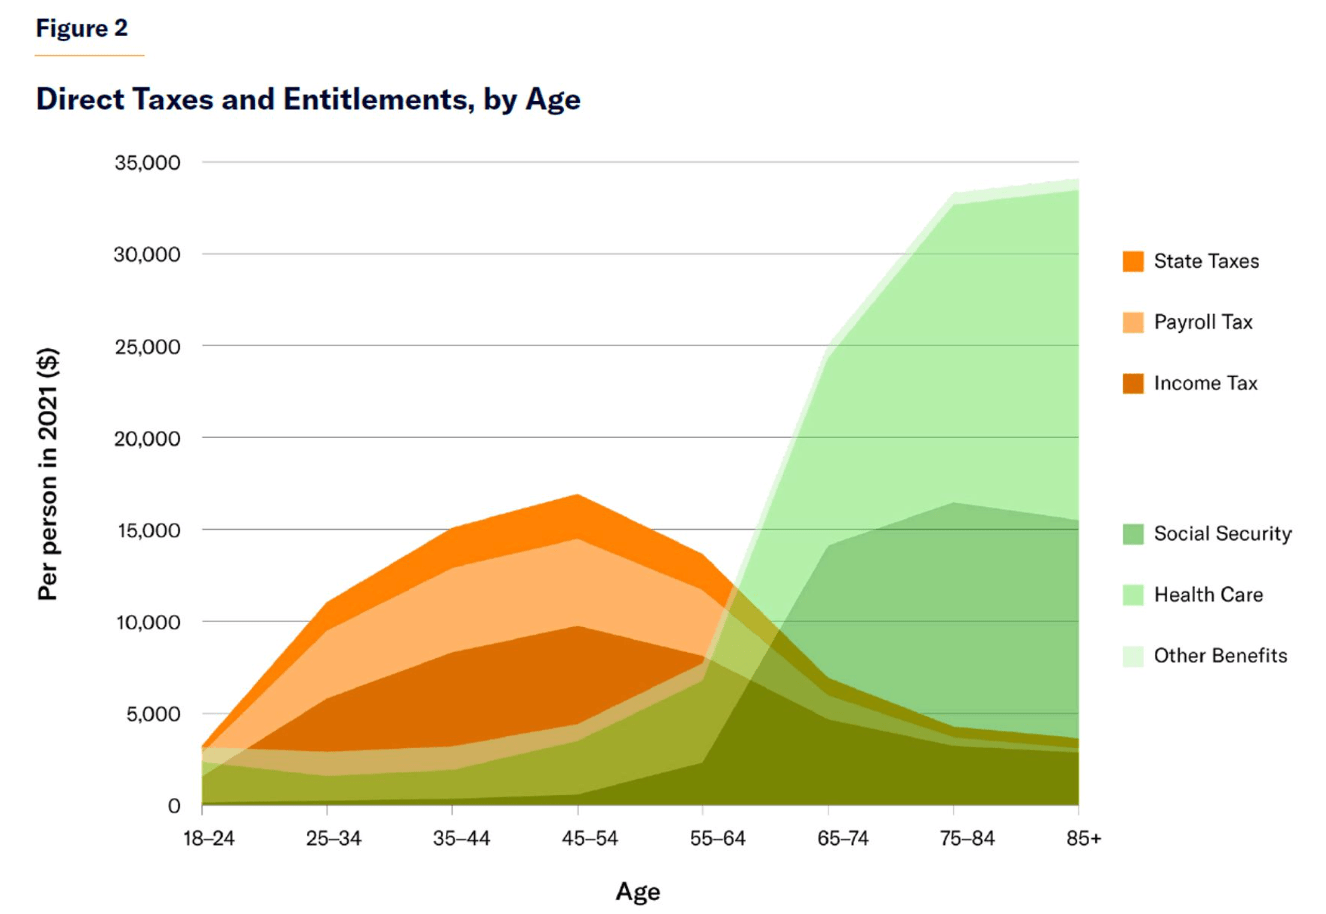
A median-wage worker retiring in 2027 will collect roughly $730,000 in lifetime Social Security benefits against less than $200,000 in career contributions—a 265% return once the employer-paid half of payroll taxes is excluded. The Congressional Budget Office projects Social Security, health care programs, and net interest costs together will drive 81% of the growth in total federal spending between 2023 and 2033.
Not a single vote, but decades of them
None of this stems from one ballot measure. It stems from what political scientists and think tanks across the ideological spectrum describe as a durable, self-reinforcing coalition: an electorate skewing older and more reliably at the polls, represented by lawmakers drawn overwhelmingly from their own ranks, repeatedly choosing to cut taxes, expand benefits, or decline to touch either.
Yale professor Samuel Moyn calls it an “oldigarchy” and dedicated a recent book to attacking America’s “gerontocracy.” Moyn told Fortune in July that even he’s been stunned by the denial and anger he’s received from pointing this out: “I had not known that LinkedIn was really a site where there were a lot of just like, senior citizens, you know, spewing out hatred,” he said. “It’s been extraordinary.”
Voters 65 and older make up about 18% of the electorate but cast 25% of votes, according to polling data from earlier this year, and Medicare protection now draws support above 89% among seniors of both parties. That asymmetry helps explain why entitlement reform has remained, in Washington’s own cliché, the third rail of American politics — a program’s beneficiaries vote in outsized numbers, and the politicians who depend on their support are disproportionately their peers.
The Peter G. Peterson Foundation, which has tracked the debt’s rise across multiple thresholds this year, frames the mechanism in blunter terms. “We’re basically taking $2 trillion from our future,” Foundation CEO Michael Peterson said as the debt passed $40 trillion, warning that the Social Security trust fund will be exhausted within six years, triggering automatic benefit cuts of 22% for future retirees if Congress does not act. Unlike some generational critics, Peterson stops short of assigning blame to a single age cohort’s voting behavior, framing the debt instead as a bipartisan failure of political will.
As far back as 2019, the American Enterprise Institute hosted a discussion of Joseph Sternberg’s book The Theft of a Decade, which argued the “policy choices of baby boomers” had “mortgaged their children’s future to pay for their own economic comforts”—a thesis published half a decade before the current debt crossing, suggesting the generational framing predates and will likely outlast this particular fiscal milestone.
What the data doesn’t fully support
The clean, singular version of this story—that boomers as a bloc voted to load the debt onto their descendants—oversimplifies a more tangled political history. Much of Social Security and Medicare’s basic architecture predates boomer political power altogether; Lyndon Johnson signed Medicare into law in 1965, when the oldest boomers were 19. Boomer officeholders split closely by party on tax and spending questions, and CRFB’s own accounting shows entitlement growth explains a comparable, not dominant, share of the debt alongside tax cuts and discretionary spending, including two recession responses — the 2008 financial crisis and the COVID-19 pandemic—that were not boomer policy choices in any partisan sense but emergency reactions with broad public and elite support.
What the record supports more precisely is a story of governance, not a single act of self-dealing: a generation that has occupied the presidency in seven of the last nine elections, held Senate majorities into 2025, and consistently faced reelection incentives to protect the benefits it was owed and defer the bill—a governing pattern less like a single vote and more like a 25-year lease renewed again and again, with the last payment due from someone else.
For this story, Fortune journalists used generative AI as a research tool. An editor verified the accuracy of the information before publishing.